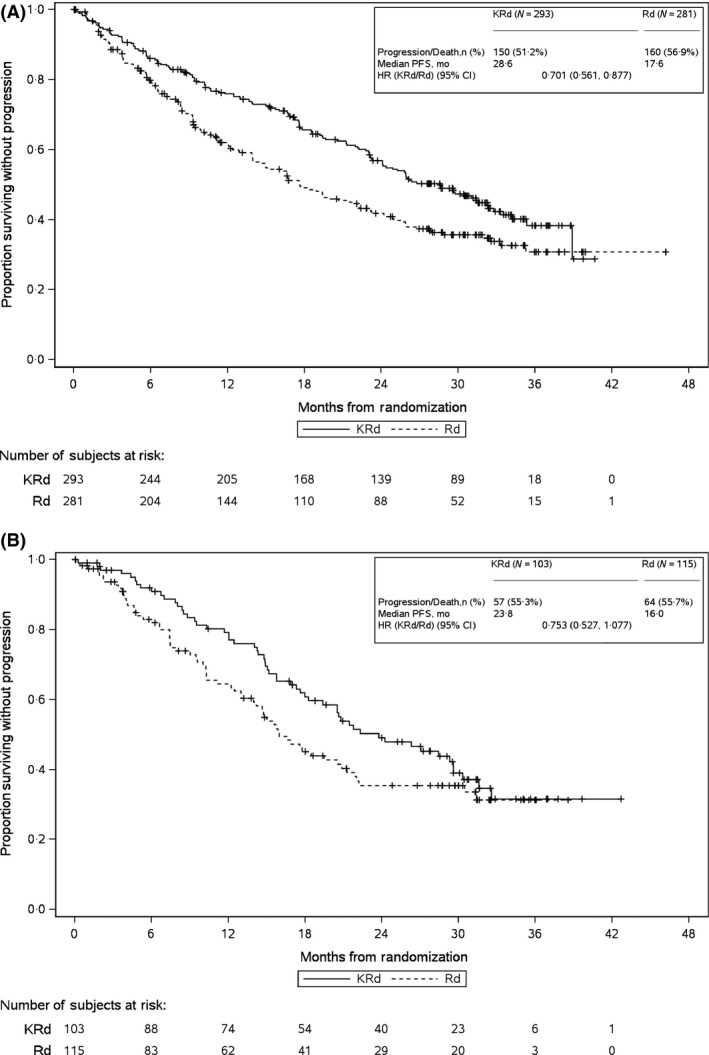
Figure 1.

Kaplan–Meier PFS Curves for (A) <70 years of Age Subgroup and (B) ≥70 years of Age Subgroup. CI, confidence interval; HR, hazard ratio; KRd, carfilzomib‐lenalidomide‐dexamethasone; mo, months; PFS, progression‐free survival; Rd, lenalidomide‐dexamethasone
