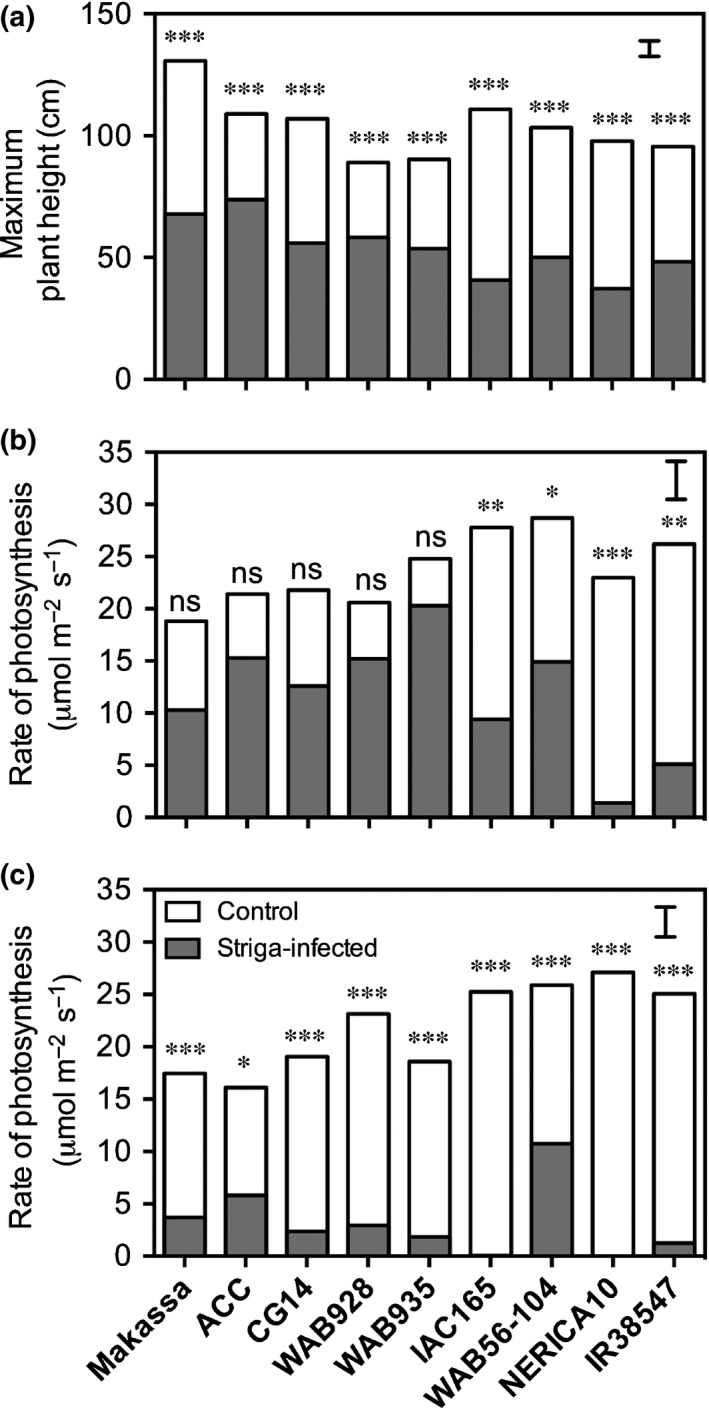
Figure 7.

(a) Maximum rice plant height and (b, c) light‐saturated photosynthesis at (b) 30 and (c) 45 d after sowing (DAS) for a subset of genotypes grown in Striga asiatica‐infested (grey bars) and Striga‐free control (white bars) pots. Significant within‐genotype differences between infected and uninfected plants are indicated: *, P < 0.05; **, P < 0.01; ***, P < 0.001; ns, not significant. Error bars indicate ± SE.
