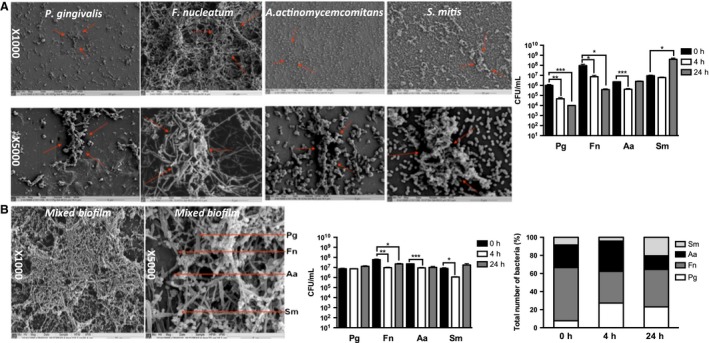
Figure 1.

Scanning electron micrographs and total viable cell counts of fresh monospecies and multispecies biofilms. (A) Scanning electron microscopy images of Porphryomonas gingivalis (Pg), Fusobacterium nucleatum (Fn), Aggregatibacter actinomycetemcomitans (Aa) and Streptococcus mitis (Sm) monospecies biofilms, and their survival over 24 h in cell‐culture medium. The bar chart shows the mean number [given in colony‐forming units (CFU)/mL] of viable bacteria recovered from the biofilms ± standard error of the mean. (B) Scanning electron microscopy images of multispecies biofilms, arrows in the SEM show examples of each of the 4 different bacteria. Data shown represent survival over 24 h in cell‐culture medium. The results are given in CFU/ml (grouped bar chart) and as proportional changes in biofilm composition shown as percentage total (%) of the total number of bacteria mixed‐species biofilm (stacked bar chart). Statistical analysis was performed on square root transformations of the CFU/mL value using a two‐tailed independent‐sample t‐test (*p < 0.01, **p < 0.001, ***p < 0.0001).
