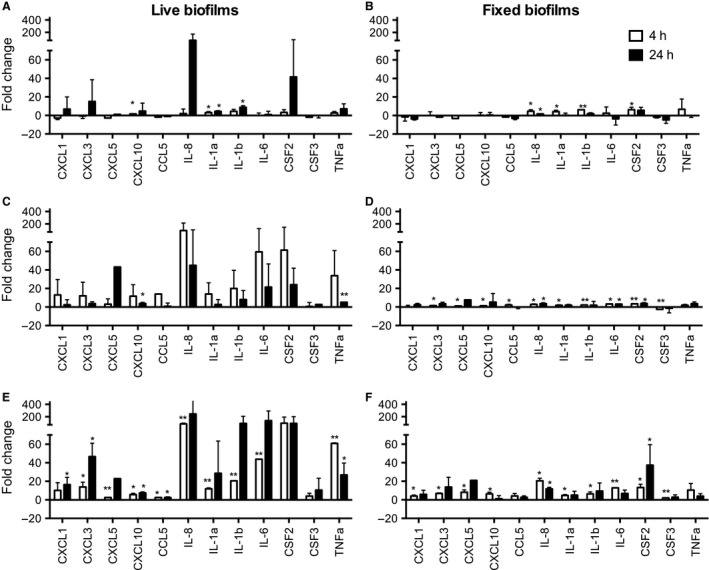
Figure 2.

Gene‐expression changes in epithelial cells following stimulation with different biofilms. OKF6‐TERT2 epithelial cells were challenged with live (A, C and E) or fixed (B, D and F) biofilms of Streptococcus mitis (A and B), Porphryomonas gingivalis (C and D) and mixed‐species biofilms (E and F) for 4 h (white bars) and 24 h (black bars). Expression of mRNA for gingivitis related genes was assessed using the TaqMan® Low Density Array. Gene expression was normalized to that of the glyceraldehyde‐3‐phosphate dehydrogenase (GAPDH) endogenous control. The bars in each chart represent fold change in gene expression relative to the medium‐only control. Statistical analyses were performed on ΔΔC t values. *Significantly different from the medium‐only control, p < 0.05; **significantly different from the medium‐only control after Bonferroni correction of the p value. Gene symbols and definitions: CCL5, C‐C motif chemokine ligand 5; CSF2, colony‐stimulating factor 2; CSF3, colony‐stimulating factor 3; CXCL1, C‐X‐C motif chemokine ligand 1; CXCL3, C‐X‐C motif chemokine ligand 3; CXCL5, C‐X‐C motif chemokine ligand 5; CXCL10, C‐X‐C motif chemokine ligand 10; IL1α, interleukin‐1alpha; IL1β, interleukin‐1beta; IL8, interleukin 8; TNFα, tumour necrosis factor, alpha.
