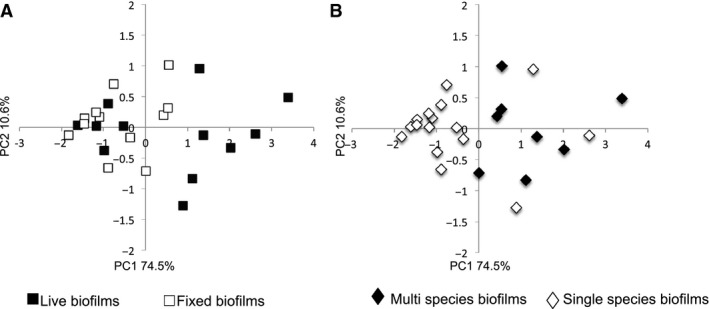
Figure 3.

Principal component analysis of changes in epithelial cell gene expression following exposure to different biofilms. The data depicted in Fig. 2 were subjected to principal component analysis. Each point represents all the experiments in which cells were stimulated by exposure to a particular condition and is a vector positioned on each axis according to the percentage variance from the origin, on two principal component axes (PC1 and PC2). (A) Data annotated to compare the response to live biofilms (solid squares) with the response to fixed biofilms (open squares). (B) Data annotated to compare the response to mixed‐species biofilms (solid diamonds) with the response to single‐species (open diamonds) biofilms.
