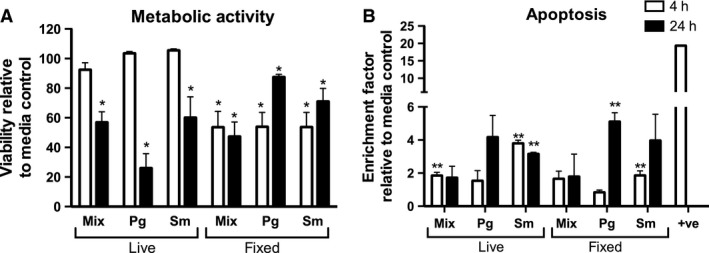
Figure 5.

Survival of epithelial cells after challenge with bacterial biofilms. Epithelial cells were challenged with live or methanol‐fixed mixed species (Mix), Porphryomonas gingivalis (Pg) or Streptococcus mitis (Sm) biofilms for 4 h (white bars) or 24 h (black bars). (A) Cell viability was assessed by staining with alamarBlue®. Data are expressed as percentage viability relative to untreated control cells; bars represent mean ± standard error of the mean of triplicate measurements of two independent experiments. (B) Epithelial cell apoptosis was assessed by histone ELISA. Bars represent mean ± standard error of the mean of two independent wells in two independent experiments. Statistical analysis was performed on square root transformation of the data and consisted of the t‐test or Welch's t‐test after assessing the data variance. *p < 0.05, less than the medium‐only control in regard to alamarBlue® reduction. For histone measurements, all treatments were significantly lower than the positive control (p < 0.01). **p < 0.05, greater than the medium‐only control.
