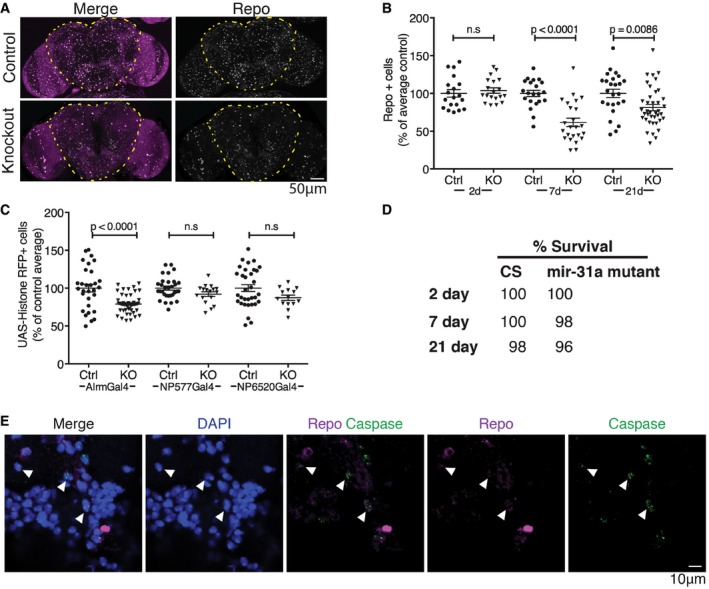
Figure 1. Loss of astrocytes in miR‐31a mutant brains.

- Representative images of 7‐days adult brains labelled with anti‐repo to visualize glia and with DAPI to label nuclei (magenta). The images show maximum projections of stacks of optical sections. The central brain region in which glia were counted is outlined.
- Number of anti‐repo‐positive glia in the central brain region at 2, 7 and 21 days. The number of glia is represented as a percentage of the average number of glia in central brains of controls for each age. P‐values were determined using t‐test (unpaired, two‐tailed) comparing control and mutant at each age. Error bars represent SEM.
- Astrocytes were labelled using Alrm‐Gal4, and cortex glia using NP577‐Gal4 to drive UAS‐Histone‐RFP. Ensheathing glia were labelled using NP6520‐Gal4 driving UAS‐Histone‐RFP. Ctrl indicates Canton S control flies. KO indicates the miR‐31a mutant background. P‐values were determined using t‐test (unpaired, two‐tailed) comparing control and mutant for each driver. ns: no significant difference. Animals were analysed at 7 days post‐eclosion. Error bars represent SEM.
- Comparison of survival rate of Canton S controls and miR‐31a mutants at 2, 7 and 21 days post‐eclosion.
- Antibody to activated caspase‐3 (green) was used to visualize apoptotic cells in 4‐days post‐eclosion miR‐31a mutant brains. Glia were labelled with anti‐repo (purple). White arrowheads point to caspase‐3‐positive, repo‐positive cells. Nuclei were labelled with DAPI. Images are single confocal slices.
