
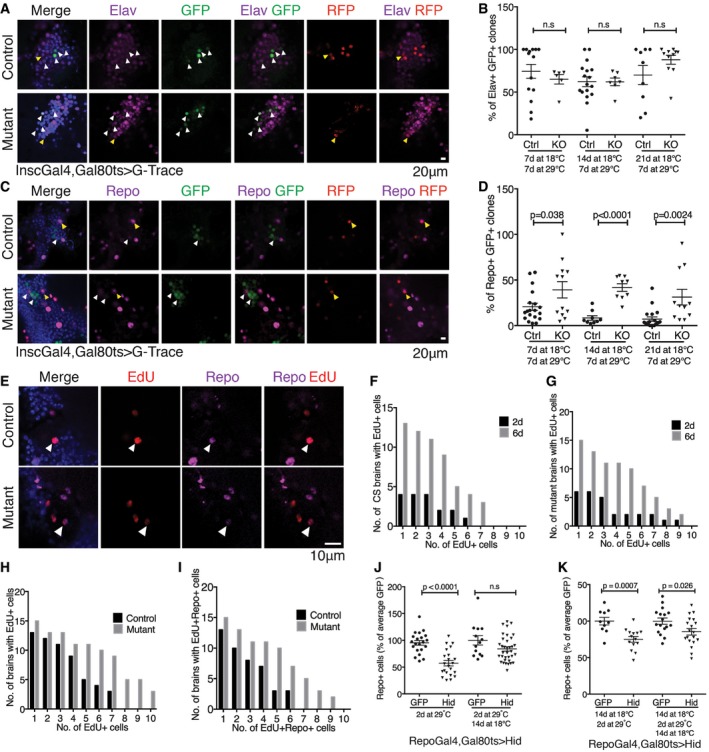
Figure 5. Lineage tracing reveals adult glia homeostasis.
-
A–DPermanent lineage tags were induced in Insc‐Gal4‐expressing cells in the adult by controlling the expression of G‐Trace [UAS‐RFP, UAS‐Flp, Ubi‐p63E(FRT.Stop)GFP] with Gal80 ts. RFP expression reflects ongoing Gal4 activity, and GFP serves as a permanent tag for cells that have expressed Gal4. Flies were shifted to 29°C at 7, 14 or 21 days and aged for 7 days at 29°C before processing. Otherwise wild‐type controls were compared with miR‐31a mutants (KO). There was very little background leakiness of Gal4 activity in flies kept at 18°C (Fig EV3E). Data were analysed using an unpaired Student's t‐test (two‐tailed). ns: not significant. Error bars represent SEM. (A, C) Optical sections through the central brain of adult flies shifted at 14 days. (A) Neurons were labelled with anti‐elav (purple). (B) Percent of clones expressing the GFP lineage tag and elav. (C) Glia were labelled with anti‐repo (purple). (D) Percent of clones expressing GFP and repo.
-
E–IEdU labelling was used to visualize cells undergoing DNA synthesis. Cells were counted in the central brain. (E) Images are single optical images of EdU‐treated Canton S (Control) and miR‐31a mutant brains from 6‐day‐old flies, 3 days after the end of EdU exposure. Note the presence of cells expressing repo and labelled with EdU (white arrowheads). (F) Number of EdU‐positive cells at 2 days or 6 days after eclosion in control animals. (G) Number of EdU‐positive cells at 2 days or 6 days after eclosion in mutant animals. (H) Counts of EdU‐positive cells in Canton S controls and miR‐31a mutants 6 days post‐eclosion. (I) Counts of anti‐repo‐positive and EdU‐positive in the central brains of Canton S controls and miR‐31a mutants 6 days post‐eclosion. Paired t‐test was used.
-
J, KFlies carrying repo‐Gal4 and Gal80 ts were reared at 18°C until eclosion (J) or 14 days of age (K) to keep Gal4 inactive. This was followed by 2 days at 29°C to express UAS‐hid or UAS‐GFP as a control. Left: flies were examined immediately after 2 days of transgene expression. Right: flies were allowed to recover for 14 days at 18°C before processing. Anti‐repo was used to visualize the glia. Data were analysed using an unpaired t‐test (two‐tailed). ns: not significant. Error bars represent SEM.