-
A
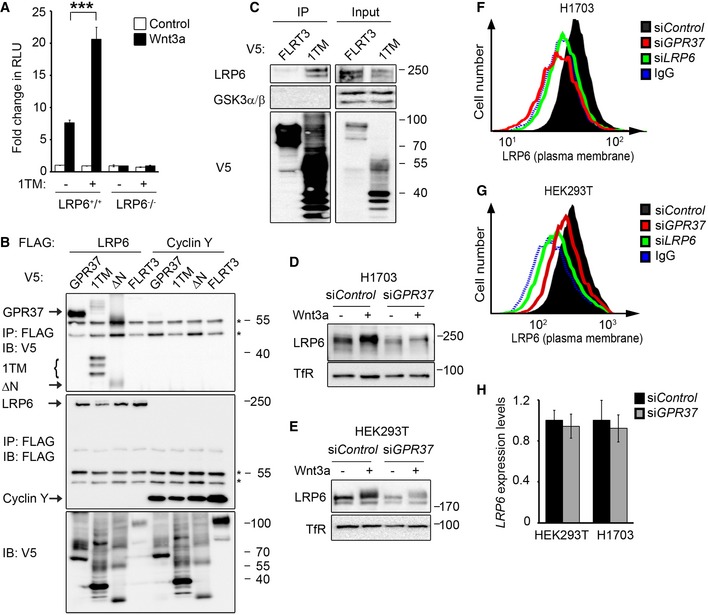
Topflash reporter assay in LRP6
+/+ and LRP6
−/− HEK293T cells. Cells were transfected with GPR37‐1TM (1TM) or control vector and treated as indicated (mean values ± SD, n = 3; ***P < 0.001, one‐way ANOVA followed by Holm–Sidak test).
-
B
Co‐immunoprecipitation of overexpressed LRP6 and the indicated GPR37 constructs. Immunoblots of immunoprecipitates from HEK293T cells transfected with the indicated FLAG‐ and V5‐tagged constructs. IgG bands are indicated with an asterisk. Note that LRP6 binds preferentially the lower molecular weight band of GPR37‐1TM, which represents the ER form of GPR37‐1TM. Shown is a representative experiment carried out three times.
-
C
Co‐immunoprecipitation of endogenous LRP6. Immunoblots of immunoprecipitates from HEK293T cells transfected with the indicated V5‐tagged constructs. GSK3 serves as a negative control. Shown is a representative experiment carried out five times.
-
D, E
Immunoblots of H1703 (D) or HEK293T (E) cell lysates upon knockdown of GPR37. Transferrin receptor serves as a loading control. Shown are representative experiments carried out eight and seven times, respectively.
-
F, G
FACS analyses of cell surface LRP6 protein levels upon knockdown of GPR37 or LRP6 in H1703 (F) or HEK293T (G) cells. Blue dotted line shows background signal upon staining with control IgGs. Shown are representative experiments carried out three times.
-
H
qPCR analysis of LRP6 expression levels in HEK293T or H1703 cells upon knockdown of GPR37 (mean values ± SD, n = 3).

