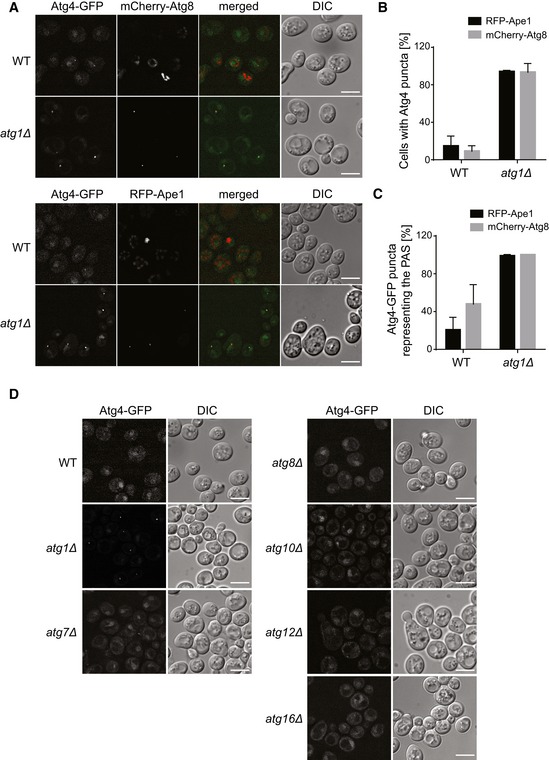
Subcellular distribution of Atg4‐GFP under autophagy‐inducing conditions in WT and atg1∆ strains expressing the PAS marker proteins RFP‐Ape1 (SAY071 and SAY020) and mCherry‐Atg8 (MNY006 and SAY010 transformed with pCumCherryV5Atg8). DIC, differential interference contrast. Scale bars, 5 μm.
Percentage of cells in which Atg4‐GFP is observed in a punctate structure in the experiments depicted in panel (A). Data represent the average of three independent experiments ± standard deviation (SD).
Percentage of Atg4 puncta co‐localizing with the PAS marker proteins Atg8 and Ape1 in the experiments shown in panel (A). Data represent the average of three independent experiments ± SD.
Localization of Atg4‐GFP in WT (MNY006), atg1∆ (SAY10), atg7∆ (SAY014), atg8∆ (SAY015), atg10∆ (SAY059), atg12∆ (SAY029), and atg16∆ (SAY064) mutant strains, under starvation. Cells were analyzed by fluorescence microscopy as in panel (A). DIC, differential interference contrast. Scale bars, 5 μm.

