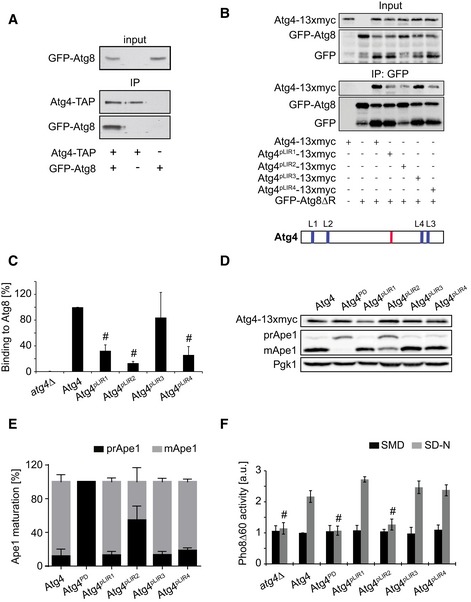
Atg4‐TAP atg8∆ (yMS69) or atg8∆ (yCK765) strains carrying an empty plasmid (pRS416) or one expressing GFP‐Atg8 (pCK15) were grown to a log phase and exposed to 220 nM rapamycin for 1 h before preparing cell extracts. Atg4‐TAP was subsequently immunoprecipitated using IgG magnetic beads. Finally, immunoprecipitates were analyzed by Western blot for GFP and protein A.
The atg4Δ (SAY084) or the atg4Δ (JAY151) strains carrying the integrative GFP‐ATG8ΔR plasmid were transformed with the centromeric plasmids expressing either Atg4‐13xmyc, Atg4pLIR1‐13xmyc, Atg4pLIR2‐13xmyc, Atg4pLIR3‐13xmyc, or Atg4pLIR4‐13xmyc. The strains were exponentially grown before being nitrogen starved in SD‐N medium for 1 h. Cell lysates were then subjected to pull‐down experiments using GFP‐trap agarose beads. Isolated proteins, 1% of cell lysate (input) or 50% of the pull‐down material (IP: GFP), were resolved by SDS–PAGE and analyzed by Western blot using either anti‐myc or anti‐GFP antibodies. A schematic view of the distribution of the putative LIR motif (blue), that is, LIR1 (L1), LIR2 (L2), LIR3 (L3), and LIR4 (L4), and the catalytic site (red) over within Atg4 is presented on the bottom of the panel.
Quantification of the experiments shown in panel (B). Values are relative to WT Atg4 and represent the average of three independent experiments ± SD. Significant differences (P < 0.05) between cells expressing WT Atg4 were calculated using the paired two‐tailed Student's t‐test, and they are indicated with the # symbol.
The atg4Δ (SAY084) mutant was transformed with integrative vectors expressing 13xmyc‐tagged Atg4 (SAY173) or its mutant versions (Atg4PD, SAY174; Atg4pLIR1, SAY175; Atg4pLIR2, SAY176; Atg4pLIR3, SAY177; and Atg4pLIR4, SAY178). The resulting strains were grown to a log phase in SMD medium before being nitrogen starved in SD‐N medium for 3 h. Proteins were precipitated with 10% trichloroacetic acid (TCA) and analyzed by Western blot using the anti‐myc, anti‐Ape1, and anti‐Pgk1 antibodies (loading control).
The percentages of prApe1 and mApe1 in the experiment shown in panel (D) were quantified, and values were plotted. Data represent the average of five independent experiments ± SD.
The experiment described in panel (D) was repeated with the SAY130 strain (Pho8∆60 pho13∆ atg4∆) carrying an empty pRS416 vector (atg4∆) or plasmids expressing Atg4, Atg4PD, Atg4pLIR1, Atg4pLIR2, Atg4pLIR3, and Atg4pLIR4. Pho8∆60 activity was subsequently measured before (SMD) or after (SD‐N) the nitrogen starvation and expressed in arbitrary units (a.u.). Data represent the average of three independent experiments ± SD. Significant differences (P < 0.05) between cells expressing WT Atg4 were calculated using the paired two‐tailed Student's t‐test, and they are indicated with the # symbol.

