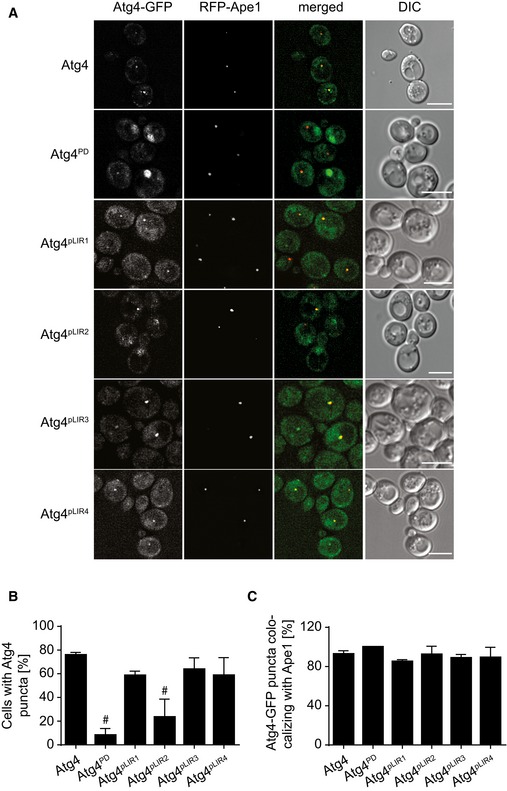
Figure 4. Atg4p LIR 2 mutant recruitment to the PAS is reduced.

- The atg1∆ cells expressing integrated RFP‐Ape1 and Atg4‐GFP (SAY136) Atg4PD‐GFP (SAY137), Atg4pLIR1‐GFP (RHY016), Atg4pLIR2‐GFP (SAY139), Atg4pLIR3‐GFP (RHY017), or Atg4pLIR4‐GFP (RHY018) were grown in YPD to an early log phase and then starved for 3 h in SD‐N medium before imaging. Scale bars, 5 μm.
- Percentage of cells in which Atg4‐GFP is observed in a punctate structure in the experiments depicted in panel (A). Data represent the average of three independent experiments ± SD. Significant differences (P < 0.05) between the Atg4 mutants and the WT were calculated using the paired two‐tailed Student's t‐test, and they are indicated with the symbol #.
- Percentage of Atg4 puncta co‐localizing with the PAS marker proteins Ape1 in panel (A). Data represent the average of three independent experiments ± SD.
