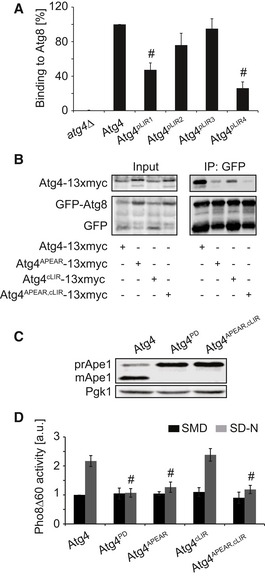
Figure 6. The double Atg4APEAR , cLIR mutant leads to enhanced in vivo defects compared to the single APEAR and cLIR mutants.

- Quantification of the experiments shown in Fig 5D. Values are relative to WT Atg4 and represent the average of three independent experiments ± SD. Significant differences (P < 0.05) between cells expressing WT Atg4 were calculated using the paired two‐tailed Student's t‐test, and they are indicated with the # symbol.
- The atg4Δ (JSY151) strains carrying the integrative GFP‐ATG8ΔR plasmid were transformed with the centromeric plasmids expressing either Atg4‐13xmyc, Atg4APEAR‐13xmyc, Atg4cLIR‐13xmyc, or Atg4APEAR,cLIR‐13xmyc. Pull‐down experiments were carried out as in Fig 2B. 2% of cell lysate (input) or 50% of the pull‐down material (IP: GFP) were resolved by SDS–PAGE and analyzed by Western blot using either anti‐myc or anti‐GFP antibodies.
- The atg4Δ (SAY084) mutant was transformed with plasmids expressing 13xmyc‐tagged Atg4, Atg4PD, and Atg4APEAR,cLIR before being grown to a log phase in SMD medium. Proteins were precipitated with TCA and subsequently analyzed by Western blot using the anti‐Ape1 and anti‐Pgk1 antibodies (loading control).
- The SAY130 strain (Pho8∆60 pho13∆ atg4∆) carrying plasmids expressing Atg4, Atg4PD, Atg4APEAR, Atg4cLIR, and Atg4APEAR,cLIR was analyzed as in Fig 2E. Data represent the average of three independent experiments ± SD. Significant differences (P < 0.05) between cells expressing WT Atg4 were calculated using the paired two‐tailed Student's t‐test, and they are indicated with the # symbol.
