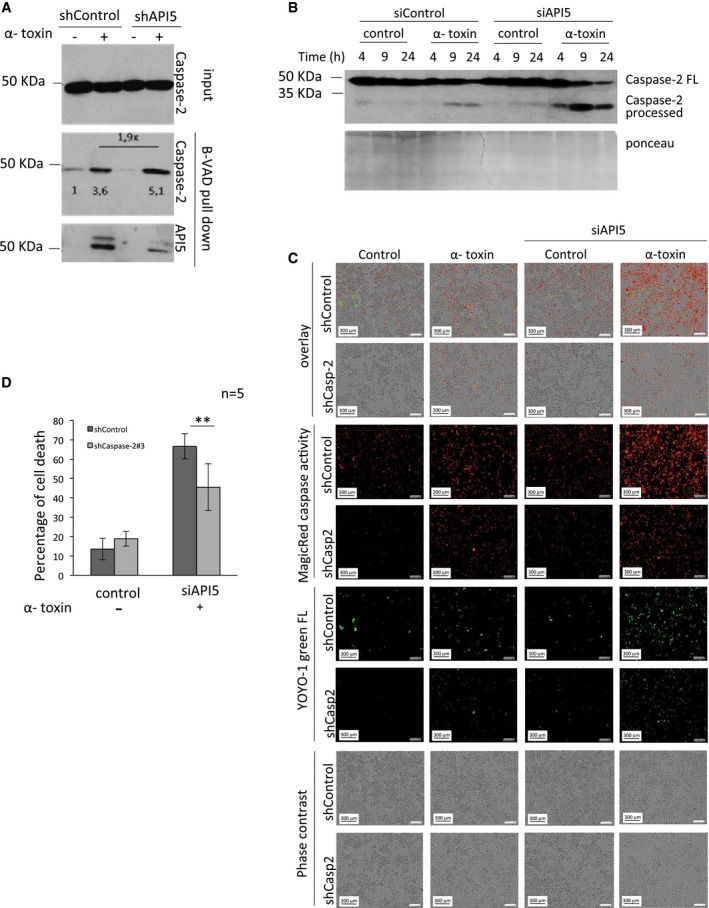
Figure 4. Depletion of API5 enhances caspase‐2 activation and caspase‐2‐dependent cell death.

- Depletion of API5 enhances caspase‐2 dimerization and activation. ShControl and shAPI5 HeLa cells were incubated with biotin‐VAD‐fmk (B‐VAD, 50 μM) 1 h prior to α‐toxin (300 ng/ml) treatment and incubated for 18 h. The active caspase‐2 complexes were precipitated with streptavidin–agarose beads as mentioned in the Materials and Methods section. The samples were then tested for the presence of active caspase‐2 and API5 by immunoblot analysis. The relative intensity of caspase‐2 bands was measured by ImageJ software and is indicated below the bands.
- HeLa cells were transfected with siRNAs, and 24 h later, they were challenged with α‐toxin at different concentrations and the processing of caspase‐2 was monitored by immunoblots. FL: full‐length caspase‐2.
- Microscopy analysis of API5‐ and caspase‐2‐depleted cells upon α‐toxin treatment. ShControl and shCaspase‐2 HeLa cells were transfected with siRNAs and 24 h later, the cells were pre‐incubated with fluorescent Magic Red Caspase substrate and green fluorescent YOYO‐1 for 30 min following the manufacturers' instructions. The cells were treated with α‐toxin (300 ng/ml) for 24 h. The images were acquired at 12 h post‐treatment in the IncuCyte imaging system. Scale bar, 300 μm.
- ShControl and shCaspase‐2 HeLa cells were transfected with siRNAs, and 1 day later, the cells were challenged with α‐toxin (300 ng/ml). The samples were subjected for Annexin V/PI measurements by flow cytometer as mentioned in the Materials and Methods. The error bars represent the mean ± SD (n = 5), **P‐value = 0.00897 (Student's t‐test).
Source data are available online for this figure.
