Figure 3.

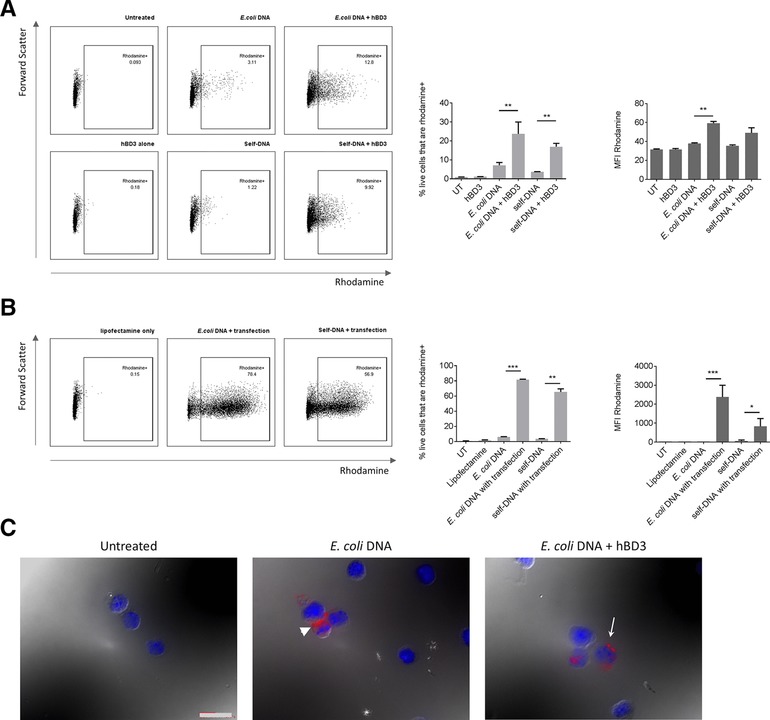
hBD3 causes increased uptake of labeled E. coli‐ and self‐DNA into mouse FLDCs and aggregation of DNA. Mouse FLDCs were incubated or transfected with rhodamine‐labeled E. coli‐DNA or rhodamine‐labeled self‐DNA with or without hBD3, or lipofection. Cell uptake was assayed by flow cytometry. Representative flow plots show gating of Rhodamine+ cells. DNA uptake was quantified by measuring proportion of rhodamine+ cells and MFI following incubation of cells with labeled DNA and hBD3 (A) or lipofectamine. (B) Data are shown as mean ± SD and are pooled from two independent experiments. *p < 0.05, **p < 0.01, ***p < 0.005 unpaired t‐test. Uptake of labeled E. coli‐DNA was visualized by fluorescence and differential interference contrast microscopy. White arrow indicates intracellular labeled E. coli‐DNA, in contrast to white arrow head indicating extracellular DNA (C). Scale bar = 400 μm. Images are from a single experiment representative of two independent experiments.
