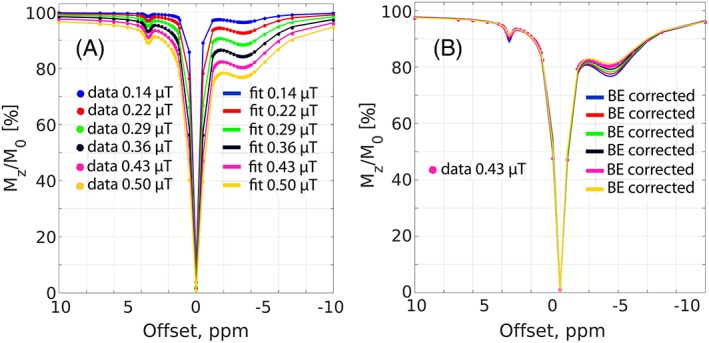
Figure 3.

A, The four‐pool Bloch‐McConnell equation simulated spectra (colored markers) at various B 1 levels and their corresponding four‐pool Bloch‐McConnell fits (colored solid lines). B, Same as A for the colored markers, but the colored solid lines represent BE‐corrected spectra recalculated at a B 1 of 0.43 μT (assumed to be nominal B 1 level) using the corresponding fitting parameters from A. A Gaussian noise of 1% (of the signal at 500 ppm) was added to the simulated data.
