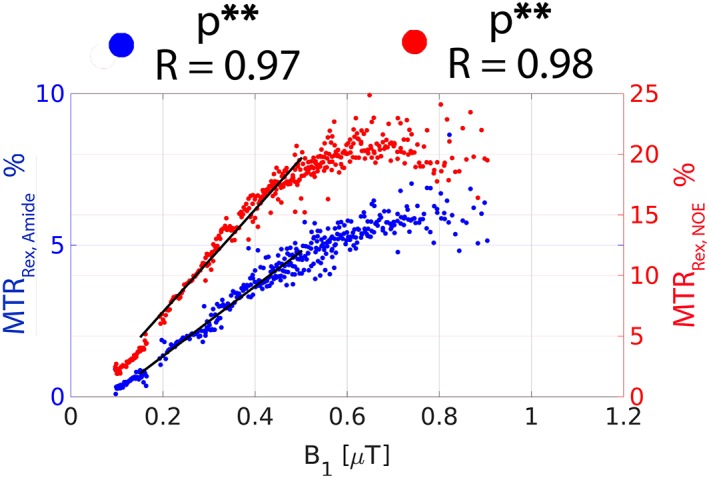
Figure 5.

The experimentally derived plots of MTRRex,amide and MTRRex,NOE as a function of the actual B 1 values in WM. The traces were obtained by segmenting the relative B 1 map (Figure 7A) into the different regions between 50% and 150% in steps of 1% and calculating the corresponding MTRRex,amide and MTRRex,NOE contrast resulting from all available CEST datasets. The straight black lines represent the linear regression relation between the corresponding metrics and B 1 in the B 1 range 0.1–0.5 μT. The Pearson correlation coefficient (R) and the corresponding p‐value are provided. **Statistical significance at the level p < 0.005.
