Figure 7.

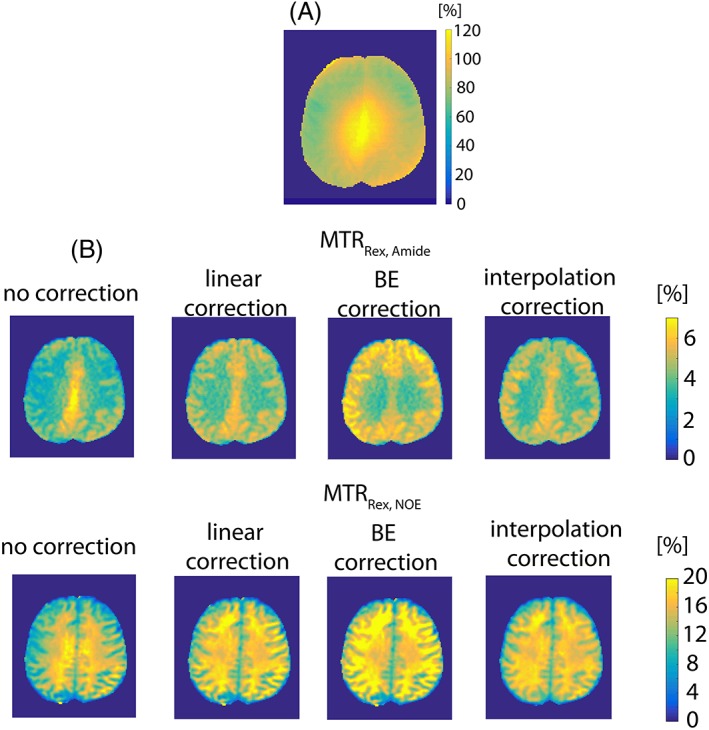
A, A relative B 1 map. B, Comparison of the experimentally derived uncorrected, the linear model B 1‐corrected, the BE B 1‐corrected and the interpolation‐based B 1‐corrected contrast for MTRRex,amide (top row) and MTRRex,NOE (bottom row).

A, A relative B 1 map. B, Comparison of the experimentally derived uncorrected, the linear model B 1‐corrected, the BE B 1‐corrected and the interpolation‐based B 1‐corrected contrast for MTRRex,amide (top row) and MTRRex,NOE (bottom row).