Figure 8.

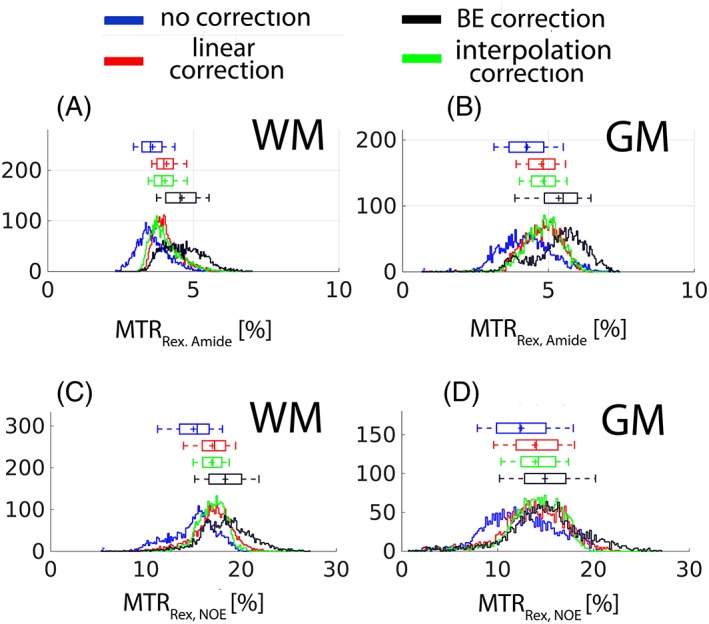
The histograms of the images shown in Figure 7B. A,B, WM and GM, respectively, for MTRRex,amide. C,D, WM and GM, respectively, for MTRRex,NOE. The box and whiskers above each histogram contain values of 25–75% and 9–91%, respectively.

The histograms of the images shown in Figure 7B. A,B, WM and GM, respectively, for MTRRex,amide. C,D, WM and GM, respectively, for MTRRex,NOE. The box and whiskers above each histogram contain values of 25–75% and 9–91%, respectively.