
Figure 4.
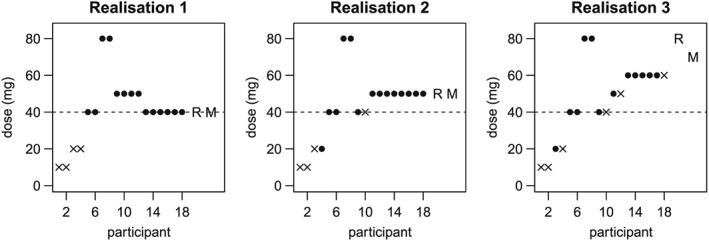
Example realisations of Scenario 1 simulation with the 5% TIL 5% TIL design
Crosses and filled circles indicate ineffective and effective responses, respectively. The dashed line indicates the target dose, and the letters ‘R’ and ‘M’ indicate the dose chosen to take forward to Stage 2 using the rule‐based criteria and model‐based criteria, respectively.