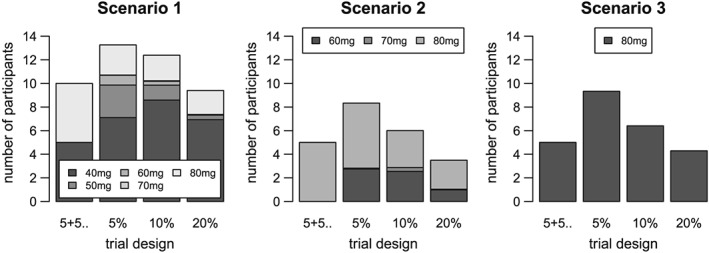
Figure 7.

Number of participants given the target and higher doses: Scenarios 1–3
The bars indicate the number of participants given the target or higher doses. The target dose is shown at the bottom of the stack, and the dose furthest away at the top. The four trial designs shown are 5+5+..=5+5+5+5, 5%=5% TIL, 10%=10% TIL and 20%=20% TIL.
