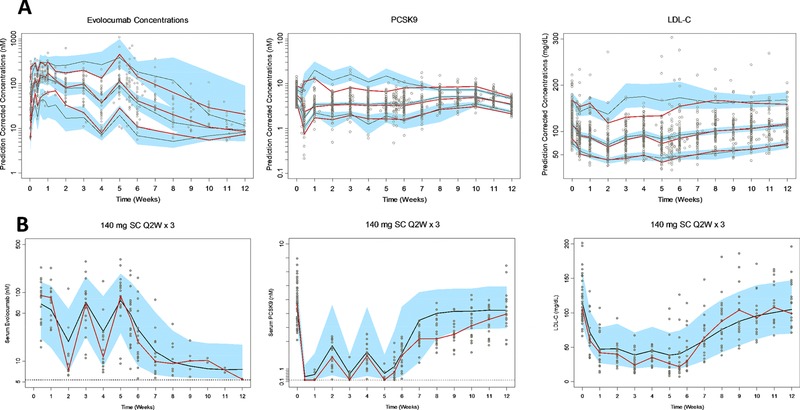
Figure 4.

(A) Prediction‐corrected visual predictive check. The red and black lines represent the median and the 5th and 95th percentiles of observed and predicted data, respectively. The blue‐shaded region represents the 95% confidence interval of the respective median and 5th and 95th percentiles of predicted data. (B) Visual predictive check of 140 mg SC evolocumab Q2W × 3, median ± 90% prediction interval of simulated pharmacokinetics and pharmacodynamics (solid black line and blue‐shaded region, respectively, for n = 100 simulations) and observed data (open circles). Red line represents the observed median.
