Figure 4.

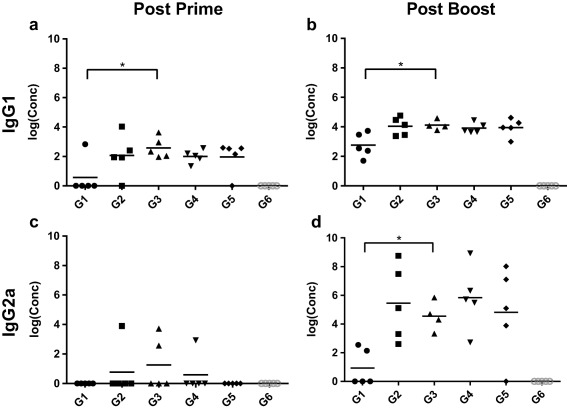
Anti‐OVA serum antibody concentrations of IgG1 and IgG2a, as assessed by ELISA. Each point represents the average concentration as determined by two technical replicates. (*p < .05)

Anti‐OVA serum antibody concentrations of IgG1 and IgG2a, as assessed by ELISA. Each point represents the average concentration as determined by two technical replicates. (*p < .05)