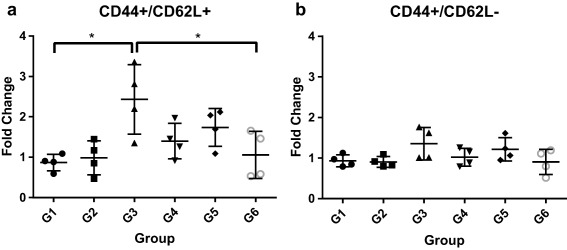
Figure 6.

Fold change of CD44+/CD62L+ (a) and CD44+/CD62L− (b) splenocytes after stimulation with 50 μg/ml OVA. Each data point is the ratio of the average number of positive cells in a stimulated versus an unstimulated sample of splenocytes. Each average was derived from two technical replicate samples of 10,000 cells each. Example gating is shown in Supporting Information Figure S3
