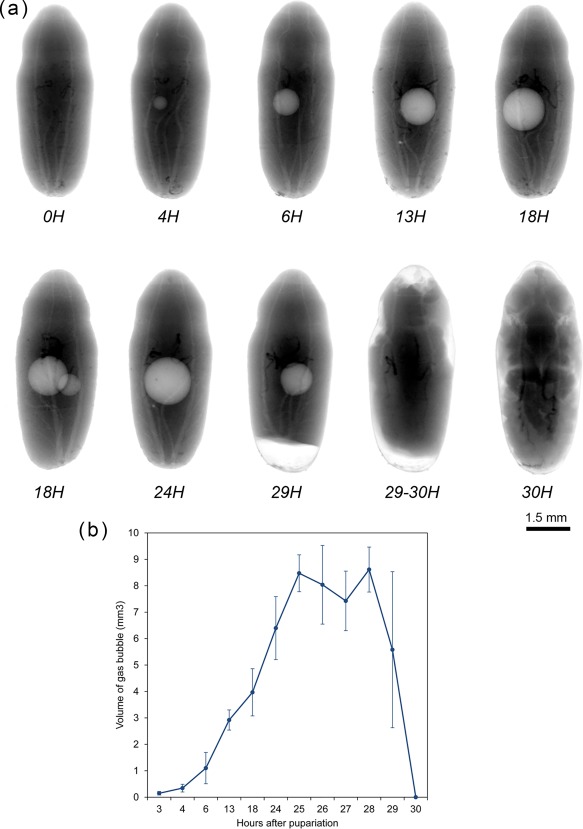
Figure 2.

(a) Calliphora vicina, X‐ray images of puparia in dorsal view, taken at different times after pupariation, reared at 24°C. Times are indicated as hours (H) after pupariation below each imaged specimen. (b) average volume ± STD of the gas bubble at different times after pupariation at a constant temperature of 24°C [Color figure can be viewed at wileyonlinelibrary.com]
