Figure 2.

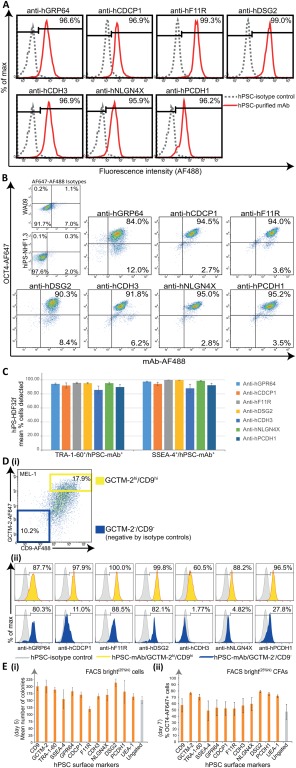
New monoclonal antibodies (mAbs) enable live cell detection and culture of self‐renewing human pluripotent stem cells (hPSCs). For undifferentiated hPSC cultures immunolabeled with new purified mAbs anti‐hGPR64, anti‐hCDCP1, anti‐hF11R, anti‐hDSG2, anti‐hCDH3, anti‐hNLGN4X, anti‐hPCDH1 (A) Representative flow cytometric histogram plots showing live cell fluorescence detection (AF488) of protein epitopes corresponding to all mAbs for a high percentage (%) of total MEL1 cells analyzed (hiPS‐NHF1.3 cells for anti‐hGPR64), (red histogram), against isotype controls (gray histogram). (B): Representative flow cytometric dot plots showing high coexpression of mAb detected hPSC‐surface proteins (AF488) and OCT4 (AF647) against isotype controls following sequential live and fixed cell immunolabeling of hiPS‐NHF1.3 cells (anti‐hGPR64) and WA09 cells (all other mAbs). (C): Multicolor immunostaining and flow cytometric replicate analyses shown graphically for the live cell codetection (mean %) of human iPS cells‐HDF32f cells by each mAb with the TRA‐1‐60 or SSEA‐4 pluripotency‐associated antibodies, compared with isotype controls (not shown). Bars represent the mean percentage of cells staining positively for each mAb within the TRA‐1‐60 or SSEA‐4 positive cell population (n = 3, mean +/− SEM). (D): Triple color flow cytometric analyses demonstrates varying coexpression profiles of each mAb with the GCTM‐2/CD9 gradient in hPSC cultures; (i) Representative flow cytometric analysis for GCTM‐2 (AF647) and CD9 (AF488) coexpression gradient in live MEL1 cell cultures. Population gates are set against isotype controls for negative (GCTM‐2‐AF647‐/CD9‐AF488‐ blue gate) and high (GCTM‐2‐AF647hi/CD9‐AF488hi yellow gate) cells; (ii) Representative flow cytometric histogram plots showing the percentage of mAb‐detected cells overlapping with the GCTM‐2/CD9 high (yellow) and negative (blue) populations against isotype controls (gray). (E): Colony‐forming assays (CFAs) for the postfluorescence activated cell sorting (FACS) culture (5,000 cells/3.8cm2 well) of hiPS‐NHF1.3 cells gated for replating the top 25% (FACS bright25%hi, orange bars) and ungated (gray bar) cells detected by mAbs compared with CD9, GCTM‐2, TRA‐1‐60, SSEA‐4, and UEA‐1 lectin; (i) Mean colony counts per well after 5 days culture in hPSC conditions (n = 3). (ii) Percentage OCT4‐AF647 positive cells detected by flow cytometry for the preceding CFAs harvested at 7 days of post‐FACS culture for FACS bright25%hi (orange bars) and ungated (gray bar) cells (n = 3). All Error bars depict SEM. Abbreviation: hPSCs, human pluripotent stem cells.
