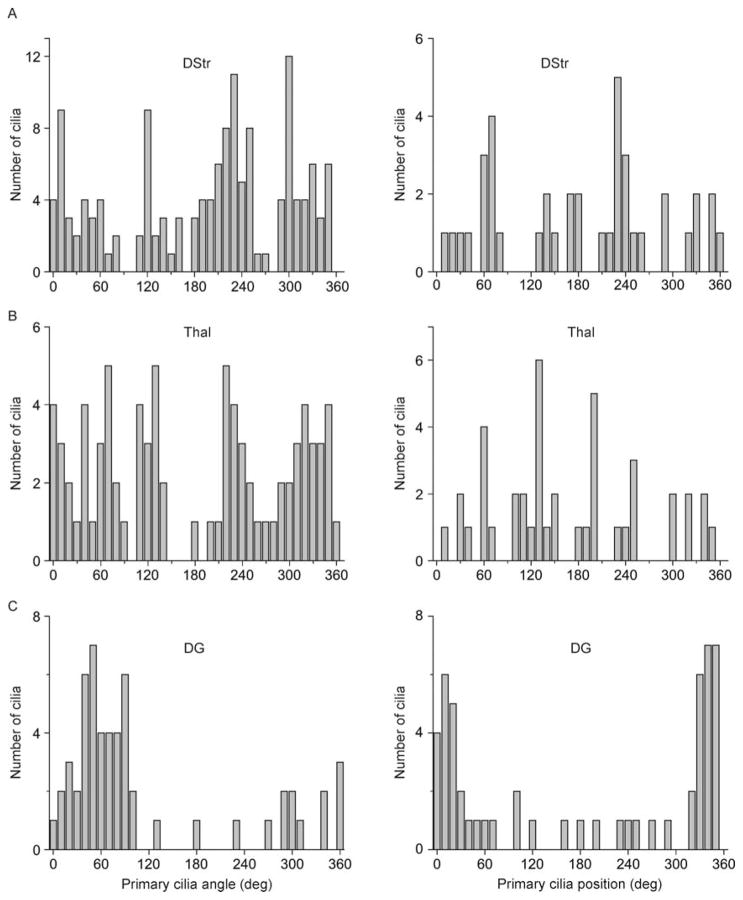
Figure 4.
Distribution of neuronal primary cilia angles and positions in dorsal striatum, thalamus, and dentate gyrus. (A) Shown are the distribution of angles (left) and positions (right) of primary cilia with respect to the cortical surface (°) in DStr. (B) Shown are the distribution of angles (left) and positions (right) of primary cilia with respect to the cortical surface (°) in Thal. (C) Shown are the distribution of angles (left) and positions (right) of primary cilia with respect to the cortical surface (°) in DG. Angle: N = 142 cells (DStr), 82 cells (Thal), 55 cells (DG); Position: N = 40 cells (DStr), 43 cells (Thal), 55 cells (DG) from 4 animals.

