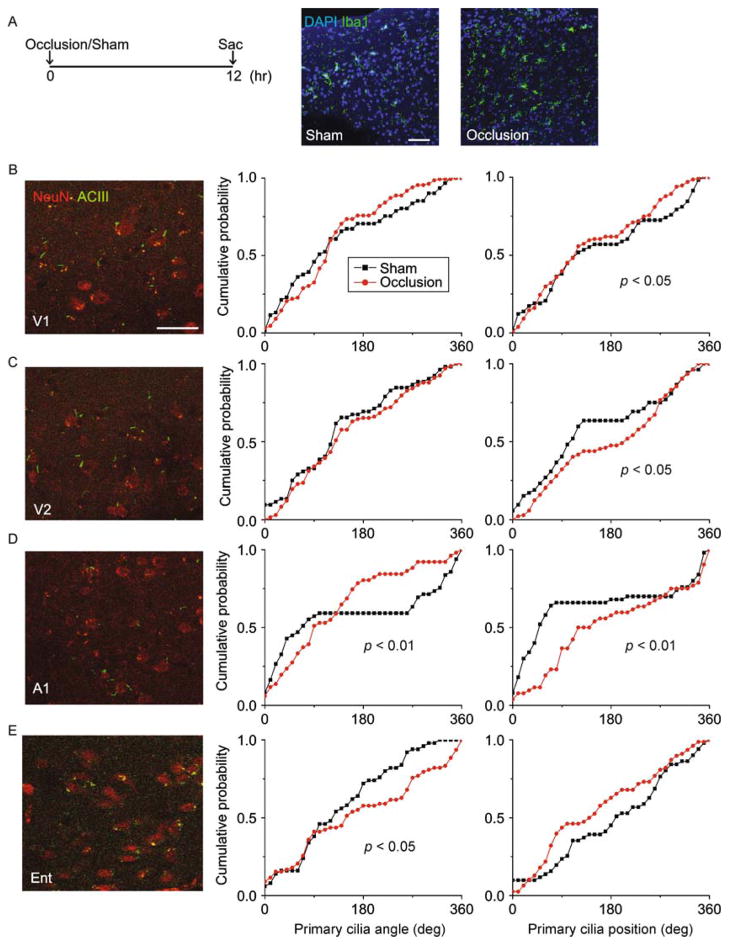
Figure 7.
Internal carotid artery occlusion disrupted primary cilia alignment in cortical neurons. (A) Shown on the left is the experimental procedure timeline. On the right are representative images of Iba1-stained sections taken from the infarct region from an animal in the occlusion condition side-by-side with a sham-operated control. The scale bar is 50 μm. (B) Shown on the left are representative images of neurons and their primary cilia in area V1 in the occlusion condition. On the right are distribution plots of primary cilia angle and position (°). (C) Shown on the left are representative images of neurons and their primary cilia in area V2L in the occlusion condition. On the right are distribution plots of primary cilia angle and position (°). (D) Shown on the left are representative images of neurons and their primary cilia in area A1 in the occlusion condition. On the right are distribution plots of primary cilia angle and position (°). (E) Shown on the left are representative images of neurons and their primary cilia in area A1 in the occlusion condition. On the right are distribution plots of primary cilia angle and position (°). Two-sample Kolmogorov–Smirnov tests: V1 position: P = 0.039, N = 59 cells (sham), 99 cells (occlusion); V2L position: P = 0.017, N = 53 cells (sham), 132 cells (occlusion); A1 angle: P = 0.004, A1 position: P <0.001, N = 50 cells (sham), 53 cells (occlusion); Ent angle: P = 0.042, N = 51 cells (sham), 83 cells (occlusion) from 3 animals per group.

