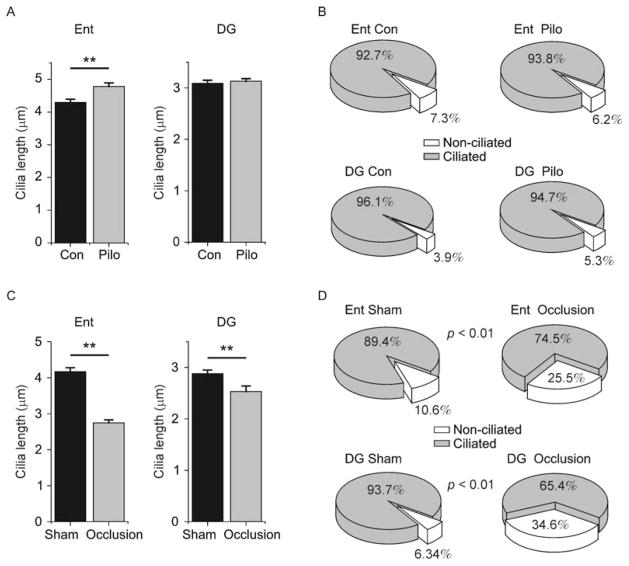
Figure 9.
Primary cilia length and number in seizure and ischemia. (A) Shown are plots of cilia lengths measured in entorhinal cortex (Ent) and dentate gyrus (DG) in mice injected with pilocarpine (Pilo) or saline (Con). Ent con: 4.27±0.11 μm, Ent pilo 4.54±0.11 μm, Kolmogorov–Smirnov test P <0.001, N = 105, 199 cells, respectively; DG con: 3.09±0.06 μm, pilo: 3.13±0.05 μm, Kolmogorov–Smirnov test P >0.05, N = 250 cells/group from 3 animals/group. (B) Shown are pie charts displaying the proportion of neurons containing (gray wedge) or lacking (white wedge) primary cilia in Ent and DG of Pilo and Con animals. Ent con: 190/205 cells ciliated, Ent Pilo: 212/226 cells ciliated, binomial test P >0.05; DG Con: 355/370 cells ciliated, DG Pilo: 319/337 cells ciliated, binomial test P >0.05. (C) Shown are plots of cilia lengths measured in entorhinal cortex (Ent) and dentate gyrus (DG) in mice that received carotid artery occlusion (Occlusion) or sham surgery (Sham). Ent sham: 4.17±0.11 um, Ent occlusion: 2.75±0.08 um, Kolmogorov–Smirnov test P <0.001, N = 150, 161 cells, respectively; DG sham: 2.88±0.07 um, DG occlusion: 2.54±0.11 um, Kolmogorov–Smirnov test P = 0.001, N = 100, 56 cells, respectively. (D) Shown are pie charts displaying the proportion of neurons containing (gray wedge) or lacking (white wedge) primary cilia in Ent and DG of Occlusion and Sham animals. (Ent sham: 186/208 cells ciliated, Ent occlusion: 117/157 cells ciliated, binomial test P <0.001; DG sham: 399/426 cells ciliated, DG occlusion: 219/335 cells ciliated, binomial test P <0.001. ** represents P <0.01.

