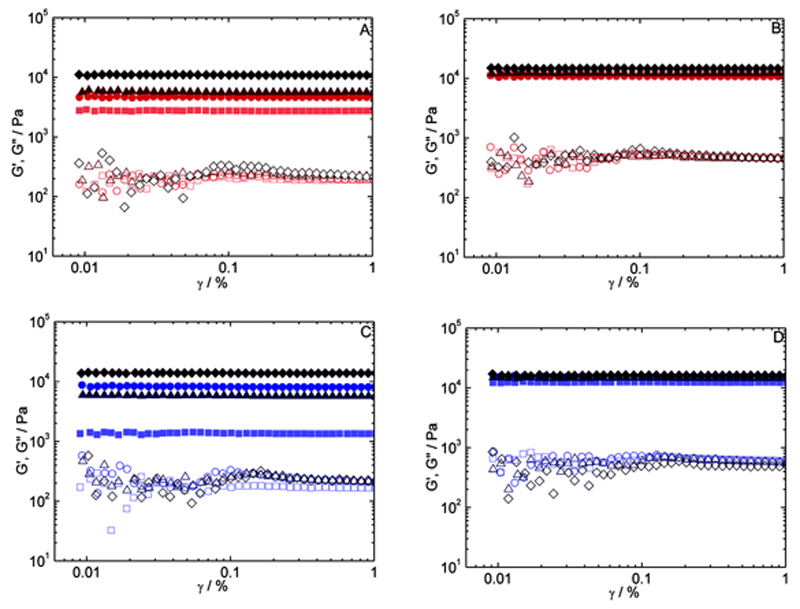
Figure 1.
Shear strain amplitude sweep curves for chitosan 2.0%/gelatin 10% A,B) chemical gels and C,D) physical-co-chemical gels. Curves in (A,C) were measured at 37 °C, above the gelatin melting temperature. Curves in (B,D) were measured a 12 °C, below the gelatin gelation temperature, to grow the physical network. mTGase concentrations of 10 (▪), 20 (●), 30 (▴), and 40 (♦) U/ggelatin G′ are shown by filled symbols, and G″ by empty symbols.

