
Figure 8.
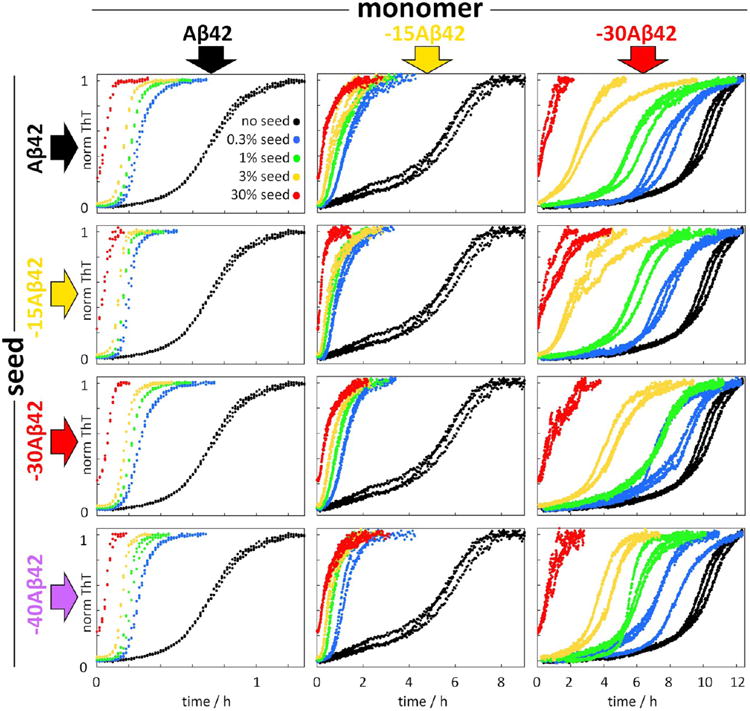
Seeded aggregation kinetics of 5 μM Aβ42 monomers (left column), 5 μM −15Aβ42 monomers (middle column), and 5 μM −30Aβ42 monomers (right column) by seeds of Aβ42 (top row), −15Aβ42 (second row), −30Aβ42 (third row), and −40Aβ42 (bottom row) in comparison with unseeded reactions (black data points). The seed concentrations are 0.3% (blue), 1% (green), 3% (yellow), and 30% (red) of the monomer concentration at time zero. The data are presented as normalized ThT fluorescence intensity versus time, with three replicates of each condition.