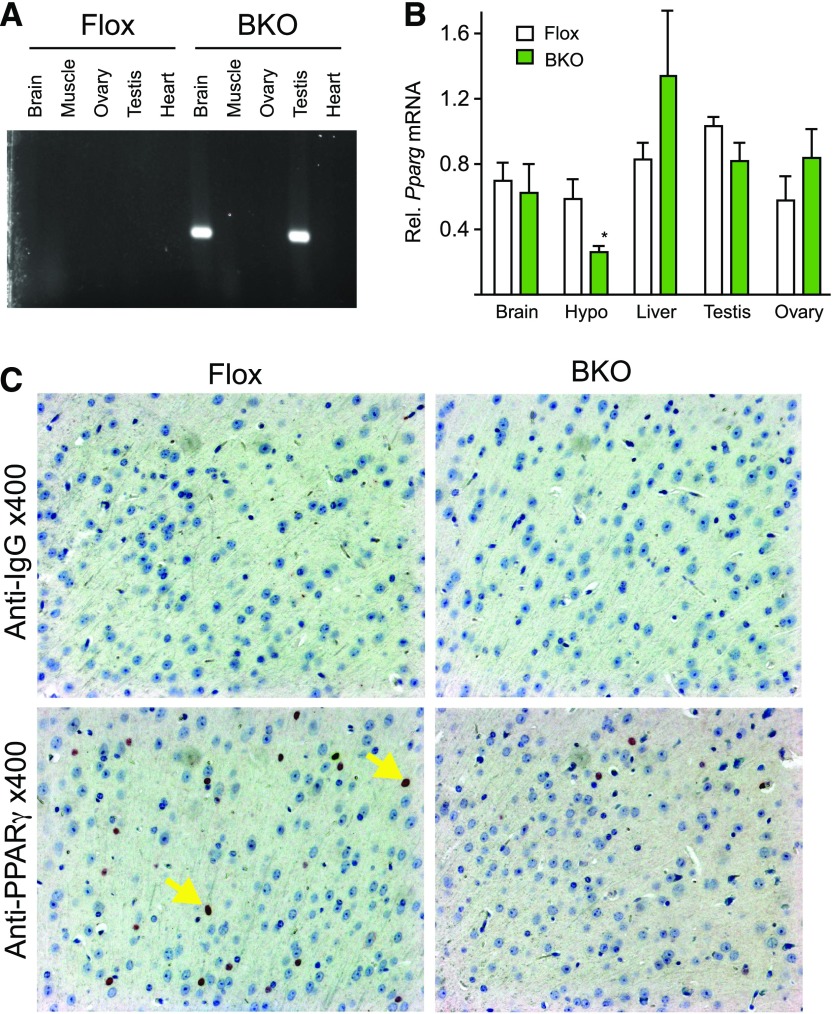
Figure 1.
PPARγ gene targeting. (A) DNA was extracted from the indicated tissues and polymerase chain reaction analysis was carried out for recombination. (B) Total RNA was isolated from the indicated tissues of WT (white) and BKO (green) mice. PPARγ mRNA levels were measured by qPCR analysis. Data shown are the fold induction of gene expression normalized with housekeeping gene and expressed as mean ± standard error of the mean (SEM). Asterisk indicates statistical significance (*P < 0.05). (C) Immunohistochemical analysis of coronal sections of brain from WT and BKO mice. Arrows indicate nuclear (blue) and PPARγ (black) staining. WT, wild type.

