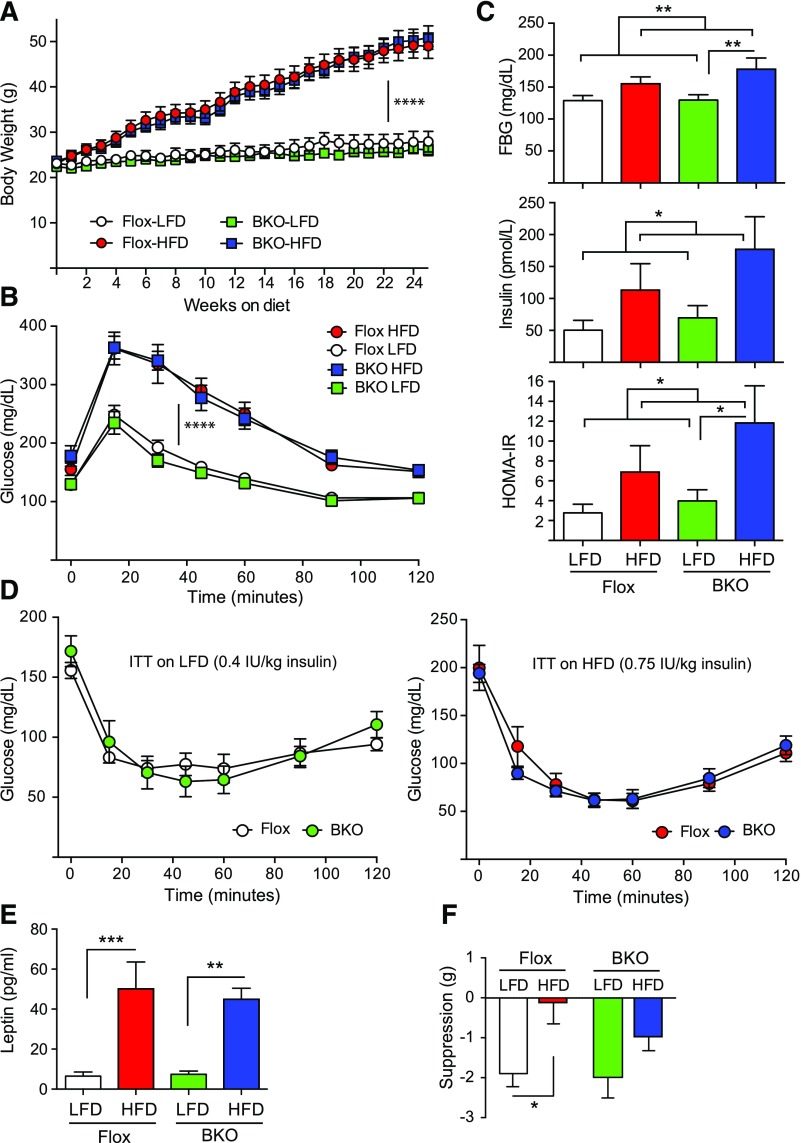
Figure 4.
Body weights and metabolic characterization of adult female BKO mice on HFD. Mice were placed on a 60% HFD or a matched 10% LFD for 24 weeks. (A) Body weight over time on diets [mean ± standard error of the mean (SEM)]. The Flox mice on LFD group is shown in white, the Flox mice on HFD group is shown in red, the BKO mice on LFD group is shown in green, and the BKO mice on HFD group is shown in blue. Flox mice are shown by circles, and BKO mice are shown by squares. Body weights on LFD or HFD show a time effect (P < 0.0001) but no genotype effect or interaction by repeated measures 2-way ANOVA. (B) IP glucose tolerance tests (1 g/kg body weight) performed on mice after 17 weeks on diets. Tail vein glucose was measured over 120 minutes (mean ± SEM; ****P < 0.0001) for diet effect. (C) Fasting blood glucose (FBG), fasting insulin, and HOMA-IR measurements for Flox and BKO mice (mean ± SEM). Fasting blood glucose, fasting insulin, and HOMA-IR showed significant diet effects (P = 0.005, 0.028, and 0.025, respectively) by 2-way ANOVA. (D) Insulin tolerance tests performed on mice after 20 weeks on diets. Mice on LFD received 0.4 IU/kg insulin, whereas those on HFD received 0.75 IU/kg due to their insulin resistance. Tail vein glucose was measured over 120 minutes (mean ± SEM). (E) Fasted leptin levels in Flox and BKO mice after 20 weeks on LFD or HFD (mean ± SEM). Leptin showed a very significant diet effect (P < 0.0001). (F) Leptin suppression of food intake. Mice received daily injections of leptin for 2 days and then injections of saline for 2 days, and food intake was measured (mean ± SEM). Suppression of food intake showed a significant diet effect (P = 0.0041) primarily in the Flox mice. Asterisks indicate statistical significance as indicated (*P < 0.05, ** P < 0.01, ***P < 0.001, and ****P < 0.0001). ITT, insulin tolerance test.

