Figure 5.
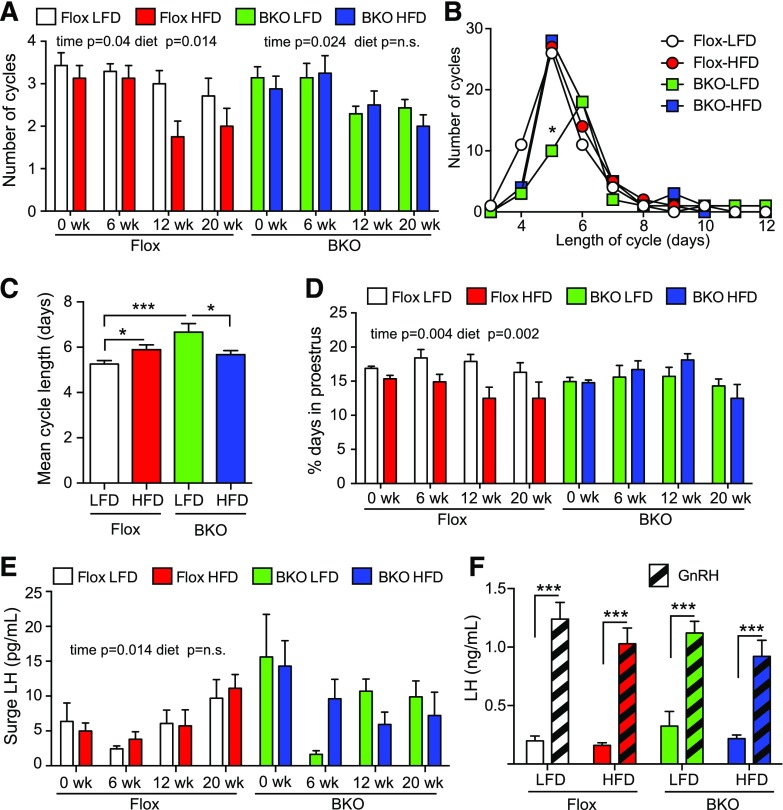
Estrous cycles over time on HFD diet. Estrous cycles were monitored by vaginal cytology for 21 days at 6, 12, and 20 weeks on diets. (A) Number of cycles over time on diets. A cycle was defined as a day of diestrus, followed by a day of proestrus and then a day of estrus. The Flox mice on LFD group is shown in white, the Flox mice on HFD group is shown in red, the BKO mice on LFD group is shown in green, and the BKO mice on HFD group is shown in blue. Data are shown as mean ± standard error of the mean (SEM). Flox mice showed a significant time and diet effect by 2-way ANOVA, but BKO did not show a difference with diet. (B) Distribution of cycle length for Flox and BKO on LFD and HFD. Cycle length was defined as the end of estrus to the end of the next estrus. Data from 6, 12, and 20 weeks was combined. (C) Mean cycle length (mean ± SEM). Cycle length showed a genotype effect (P = 0.01) and a significant interaction of genotype and diet (P = 0.0004) by 2-way ANOVA. (D) Percentage of days in proestrus. Data are shown as mean ± SEM. The Flox mice showed significant time and diet effects (P = 0.004 and 0.002, respectively). (E) Surge LH values during the afternoon (6 pm) of proestrus. The Flox mice showed significant time effect (P = 0.014). (F) GnRH stimulated LH release. Mice received GnRH (1 µg/kg) in the morning after 18 weeks on diets. Tail vein blood was taken before and 10 minutes after GnRH injection (GnRH, striped bars). Data are shown as mean ± SEM. LH values showed a very significant GnRH effect (P < 0.0001) but no differences between groups. Asterisks indicate statistical significance by testing following 2-way ANOVA (* = P < 0.05, ***P < 0.001). n.s., not significant.

