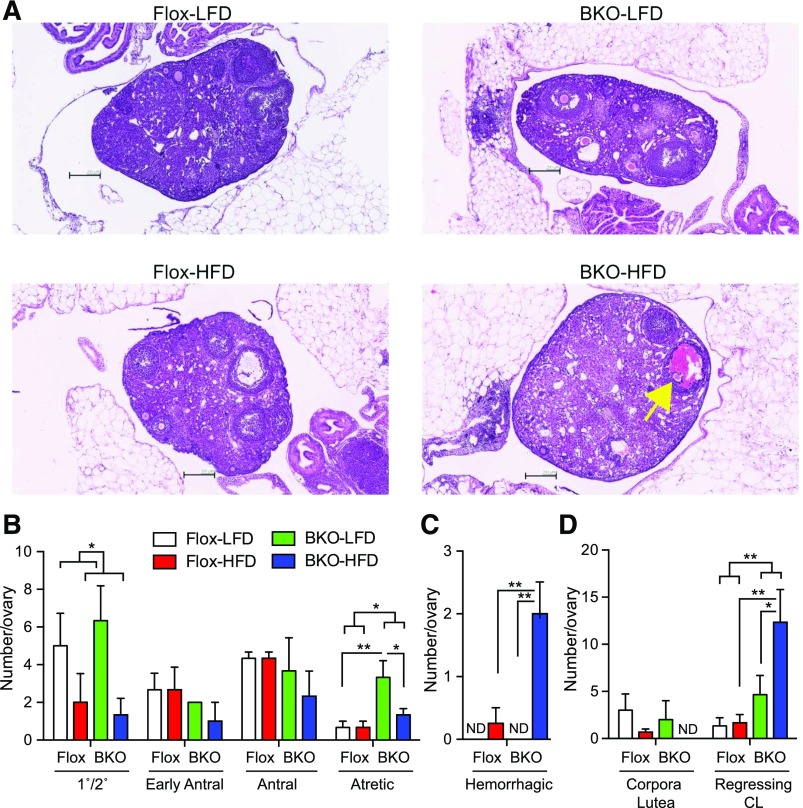
Figure 7.
Ovarian histology for mice on HFD. Mice were euthanized after 24 weeks on diets. (A) Representative Hematoxylin and eosin stained sections of ovaries from Flox and BKO mice on LFD and HFD. Yellow arrow indicates hemorrhagic follicle. (B) Number of staged follicles per 3 ovary sections [mean ± standard error of the mean (SEM)]. Primary/secondary follicle number showed a diet effect (P = 0.03), and atretic follicle number showed a genotype effect (P = 0.013) by 2-way ANOVA. (C) Number of hemorrhagic follicles per 3 ovary sections (mean ± SEM). Diet effect (P = 0.005), genotype effect (P = 0.02), and interaction (P = 0.02) by 2-way ANOVA. (D) Number of corpora lutea per 3 ovary sections (mean ± SEM). Genotype effect (P = 0.01) by 2-way ANOVA. The Flox mice on LFD group is shown in white, the Flox mice on HFD group is shown in red, the BKO mice on LFD group is shown in green, and the BKO mice on HFD group is shown in blue. Asterisks indicate statistical significance by post hoc testing after 2-way ANOVA as indicated (*P < 0.05, **P < 0.01, and ***P < 0.001). CL, corpora lutea; ND, none detected.

