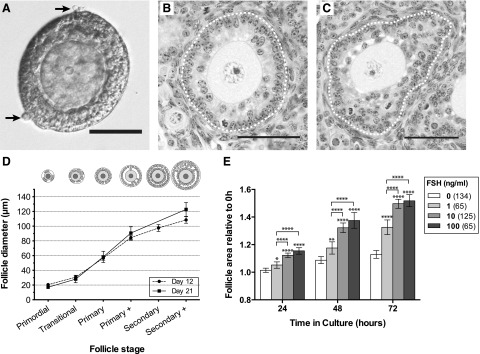
Figure 1.
Relationship between follicle stage and diameter, and response to FSH. (A) Light micrograph of a freshly isolated follicle (∼110 µm) with 2 layers of GCs visible, surrounded by a basal lamina and occasional theca cells (arrow). Scale bar = 50 µm. (B, C) Histological sections of day 12 mouse ovary stained with hematoxylin and eosin. Scale bars = 50 µm. (B) Primary plus stage follicle with second layer of GCs forming, ∼80 µm in diameter. (C) Secondary plus stage follicle developing multiple layers of GCs, ∼115 µm diameter. Dotted white line marks basal lamina. (D) Follicle diameter of follicles at successive developmental stages in 12- and 21-days-postpartum mice. Follicles were measured in a formalin-fixed, paraffin-embedded ovary. Values are mean ± 95% confidence interval. (E) Response of follicles to increasing concentrations of FSH. Relative follicle areas (area at timex/area at time0, where tx = 24, 48, or 72 hours) were compared at each time point using 1-way ANOVA with a Tukey’s multiple comparisons test. *P < 0.05; **P < 0.01; ***P < 0.001; ****P < 0.0001. Numbers in parentheses are numbers of follicles.

