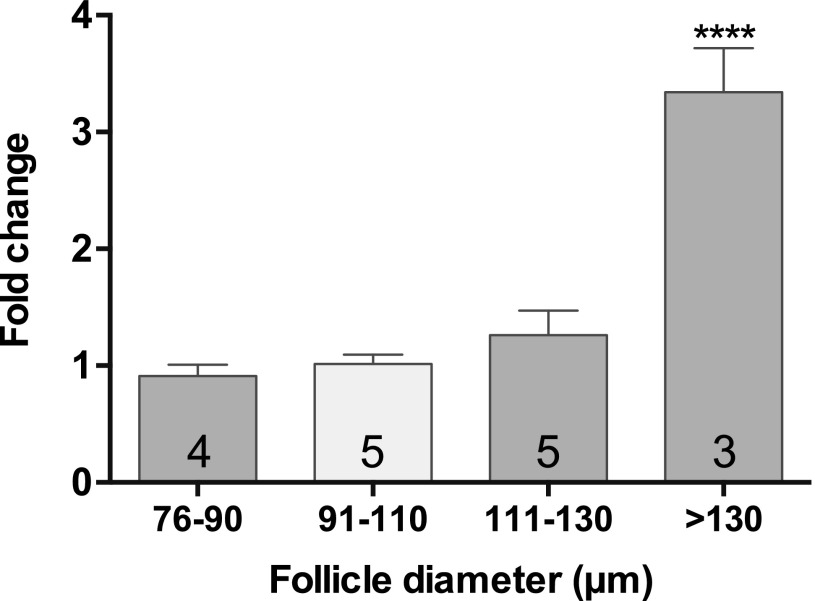
Figure 2.
Expression of Fshr in isolated preantral follicles. Comparison of abundance of Fshr in isolated follicles of increasing diameter (5 to 7 follicles per sample; number in bars = number of samples). Transcripts were normalized to Atp5b, and fold changes were calculated relative to expression in the 91- to 110-µm diameter group. Values are mean fold changes ± SEM. Fshr mRNA was detectable in follicles in each size stratum. Relative levels of Fshr in different sized follicles were compared using ANOVA with a Tukey’s multiple comparisons test. ****P ≤ 0.0001.

