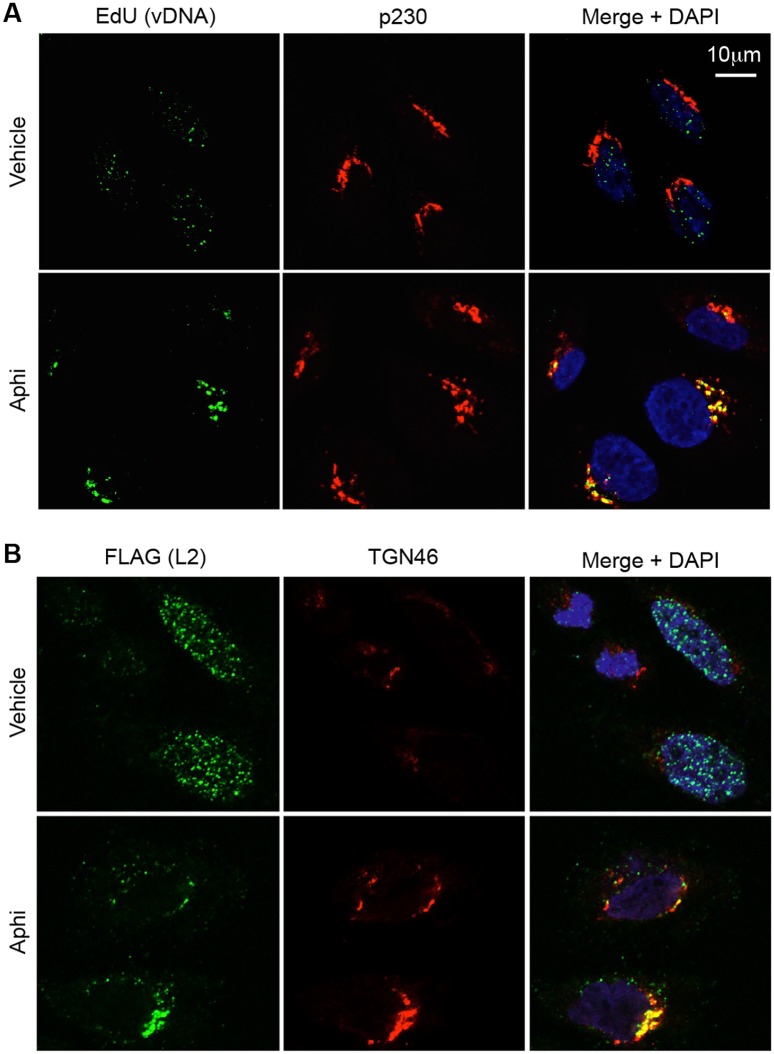
Fig 5. Cell cycle arrest traps vDNA and L2 in the TGN.
(A) Representative image slices (0.35 μm thick) of HaCaT cells infected with wt PsV containing EdU-labeled DNA. Scale bar represents 10 μm. After fixation the cells were stained with Alexa Fluor 488 azide to visualize vDNA (green), p230 for the TGN (red) and DAPI to visualize nuclei (blue). (B) Representative image slices (0.35 μm thick) of HaCaT cells infected with wt L2-3xFTHA PsV and stained for FLAG (green), the TGN marker TGN46 (red) and DAPI to visualize nuclei (blue).

