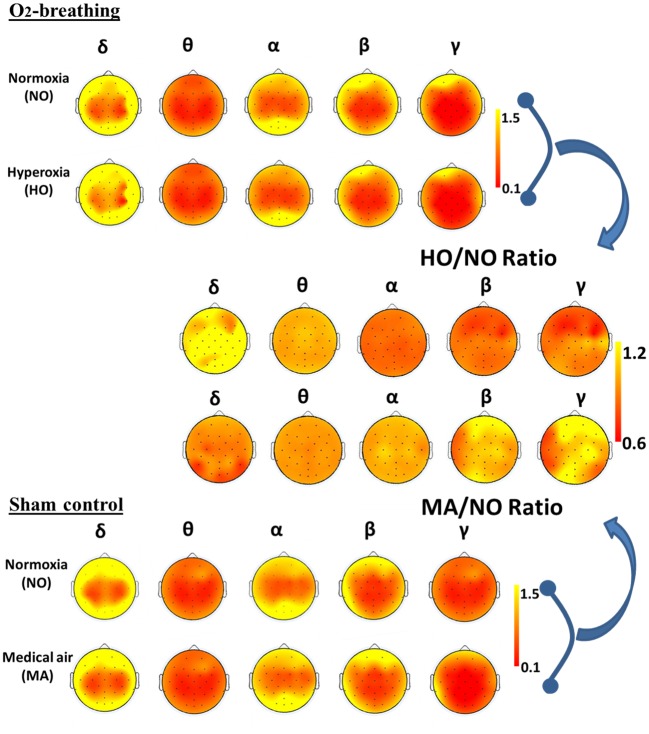
Fig 4. Topographic maps of EEG signals under normoxia and gas-challenge conditions.
In the O2-breathing experiment, the gas-challenge condition used hyperoxic gas. In the sham control experiment, the gas challenge condition used medical air. The EEG signal power was calculated for each frequency band and the maps shown are averages of all participants. In the topographic maps, the triangle on the top represents the subject’s nose, while two rectangles on each sides represent the ears. Each black dot indicates one electrode. The images on the right-hand side show the ratio between two topographic maps.

