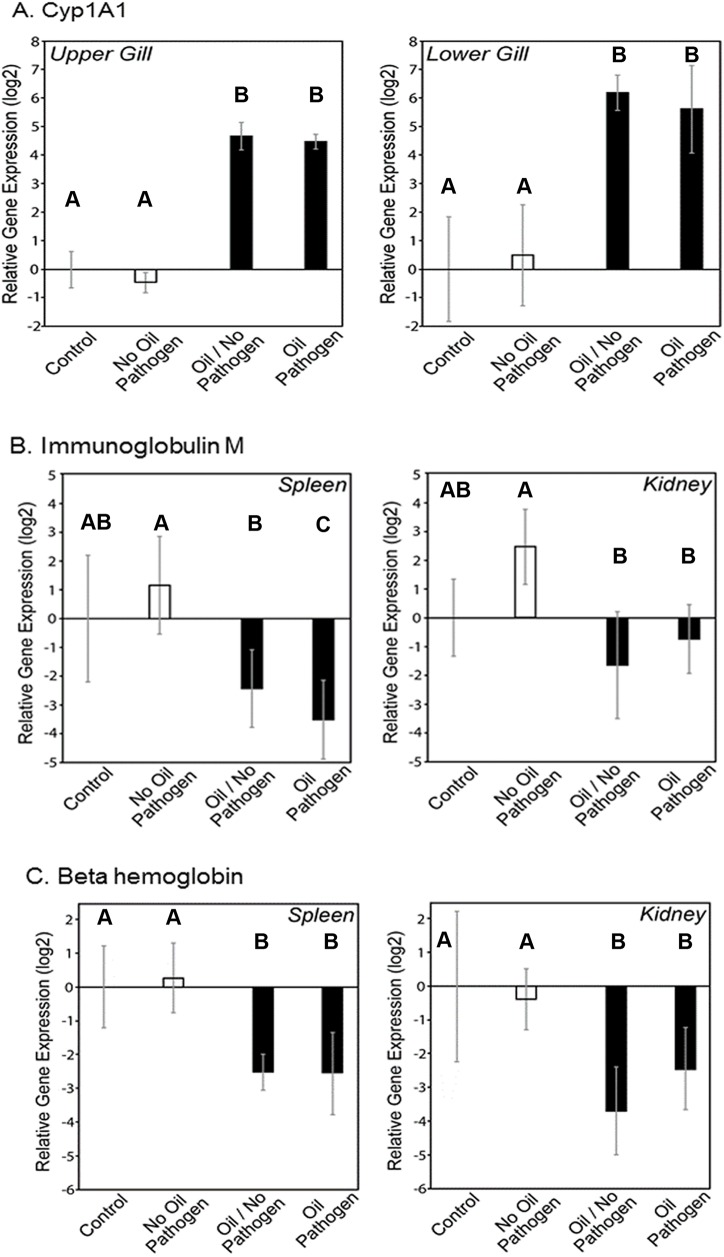
Fig 2.
Effect of oil exposure on relative gene expression for A) CYP1A in upper and lower gill tissue and B) Immunoglobulin M and C) Beta hemoglobin in spleen and kidney tissue of fish collected Day 1 post-pathogen exposure. Bars represent average gene expression (log2) relative to control fish for 3 fish per treatment and error bars represent minimum and maximum values of relative quantification based on standard deviation of Ct values from qPCR analyses.

