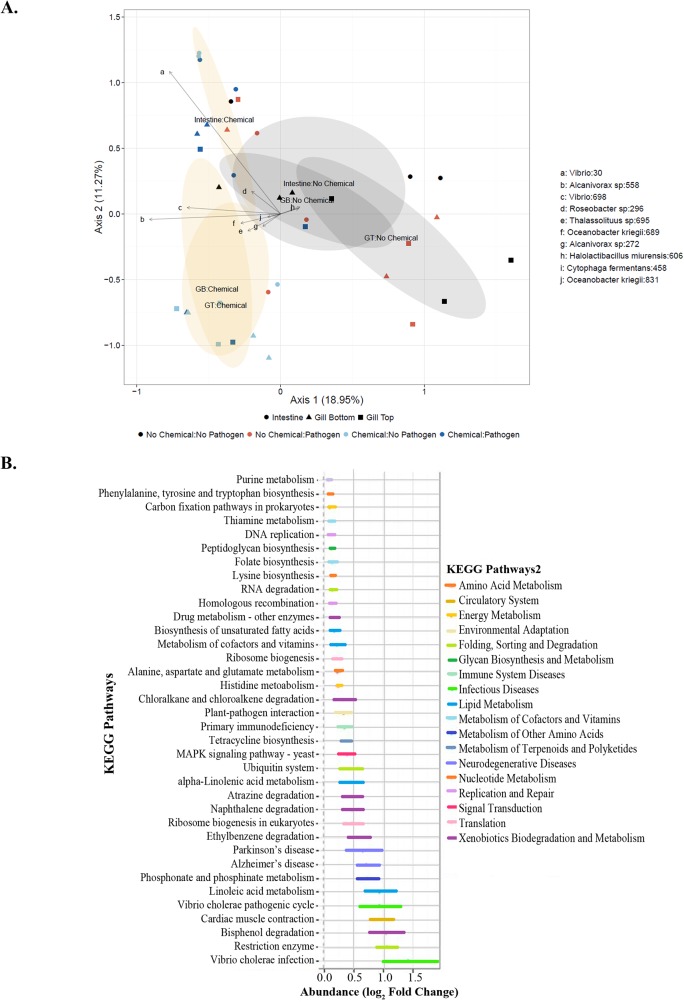
Fig 4. Effect of oil exposure on bacterial diversity and function.
(A) Principal Coordinates Analysis (PCoA) plot of data at the Order level from fish collected on Day 1 post-pathogen exposure calculated with a Bray-Curtis dissimilarity in R (v. 3.0.2 [2013-09-25]–“Frisbee Sailing”). Water and sediment samples were collected on Day 0 of the experiment. Lower case letters indicate locations of various bacterial orders (a-Vibrio, b-Alcanivorax sp, c-Vibrio, dRoseobacter, e-Thalassolitus, f-Oceanobacter kriegii, g-Alcanivorax sp, h-Halolactibacillus miurensis, i-Cytophaga fermentans, j-Oceanobacter kriegii). Symbols represent different tissue types (● Intestine, ▲Lower Gill, ■ Upper Gill). Ellipses represent non-oil exposed vs. oilexposed each defined by treatment labels in their centers and indicate 95% Confidence Intervals, with orange ellipses representing both oiled treatments and gray ellipses representing both nonoiled treatments. (B) Predictive metagenomics analysis of the intestinal bacterial taxa in Oil/Pathogen Challenged fish (compared with control fish) indicated enrichment in degradation pathways. Pathway abundance was normalized via log2 fold change.

