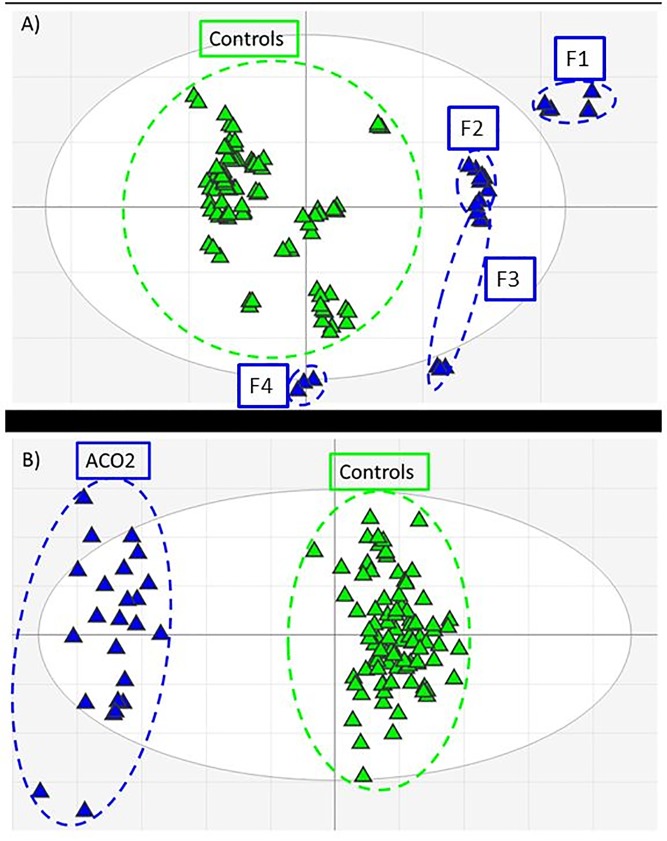
Fig 2. Multivariate analysis score plots of ACO2-deficient (blue) and matched control plasma (green) metabolomics data features.
A) Principle components analysis (PCA) indicates a clear distinction between ACO2-deficient and control profiles. F1-F4 correspond to Table 1. Metabolic variations caused by perturbed metabolic flux due to ACO2-deficiency as well as varying exogenous inputs (e.g. diet, medication) result in observed data clustering; B) Supervised orthogonal-partial least squares discriminant analysis (OPLS-DA) with data classification reveals strong feature discrimination between ACO2-deficient and control data sets.

