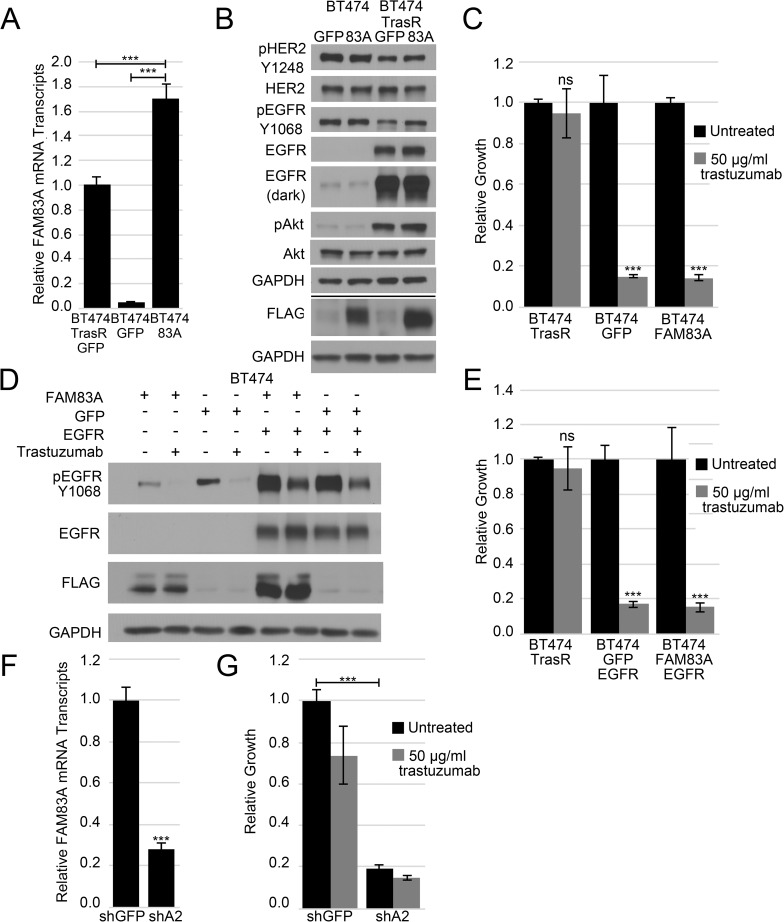
Fig 3. FAM83A in the trastuzumab resistant phenotype.
(A) Real-time PCR analysis of FAM83A mRNA expression in BT474 cells expressing exogenous FAM83A or control GFP and BT474 TrasR cells indicates exogenous BT474 FLAG-FAM83A expression is increased over endogenous BT474 TrasR cells. Error bars represent standard error of the mean. (B) Immunoblot analysis of pHER2 Y1248, HER2, pEGFR Y1068, EGFR, and FLAG in BT474 FLAG-FAM83A and control GFP and BT474 TrasR FLAG-FAM83A and GFP cells. (C) Relative growth assay of BT474 FLAG-FAM83A and GFP and BT474 TrasR cells in 10μg/ml trastuzumab reveals no change in trastuzumab sensitivity upon exogenous FAM83A expression. Error bars represent standard deviations of 3 technical replicates. (D) BT474 FLAG-FAM83A and GFP cells were transduced with exogenous EGFR. Immunoblot shows p-EGFR Y1068, EGFR, and FLAG expression in the presence or absence of trastuzumab and indicates activation of the exogenous EGFR. (E) Relative growth assay of BT474 FLAG-FAM83A/EGFR and BT474 GFP/EGFR and BT474 TrasR cells shows neither exogenous expression of EGFR alone nor in conjunction with FAM83A is sufficient to confer trastuzumab resistance. Error bars represent the standard deviation of triplicate technical replicates. (F) BT474 TrasR cells were transduced with an shRNA targeting GFP or FAM83A. Real-time PCR analysis of FAM83A mRNA expression illustrates reduced FAM83A expression in shFAM83A cells. Error bars represent standard error of the mean. (G) Relative growth assay of BT474 TrasR shFAM83A or shGFP cells untreated or treated with trastuzumab demonstrates a stark growth inhibition in shFAM83A cells, regardless of trastuzumab treatment. Error bars represent standard deviations of 3 technical replicates. ns–not significant, *p<0.05, **p<0.01, ***p<0.001, Student’s t-test.

