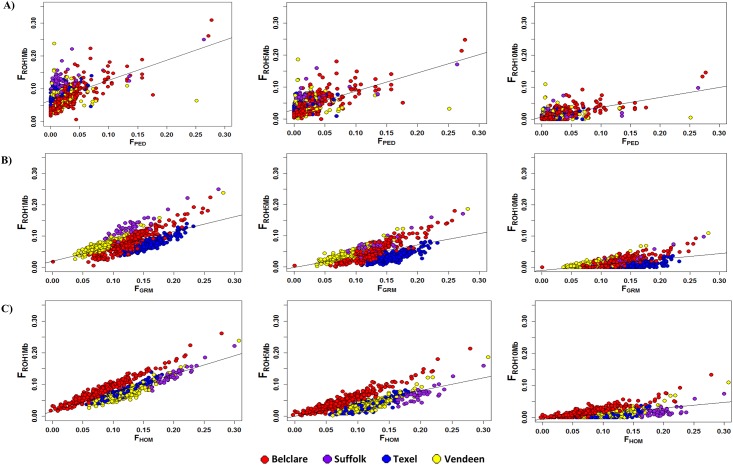
Fig 5. Matrix of scatter plots for different measures of inbreeding calculated from runs of homozygosity (FROH) versus inbreeding estimated from A) pedigree analysis (FPED), B) genomic relationship matrix (FGRM) and C) the observed versus expected homozygotes (FHOM) on 843 animals with at least 6 complete generation equivalents.
Four populations were included in the analysis; Belclare (red), Suffolk (purple), Texel (blue) and Vendeen (yellow).

