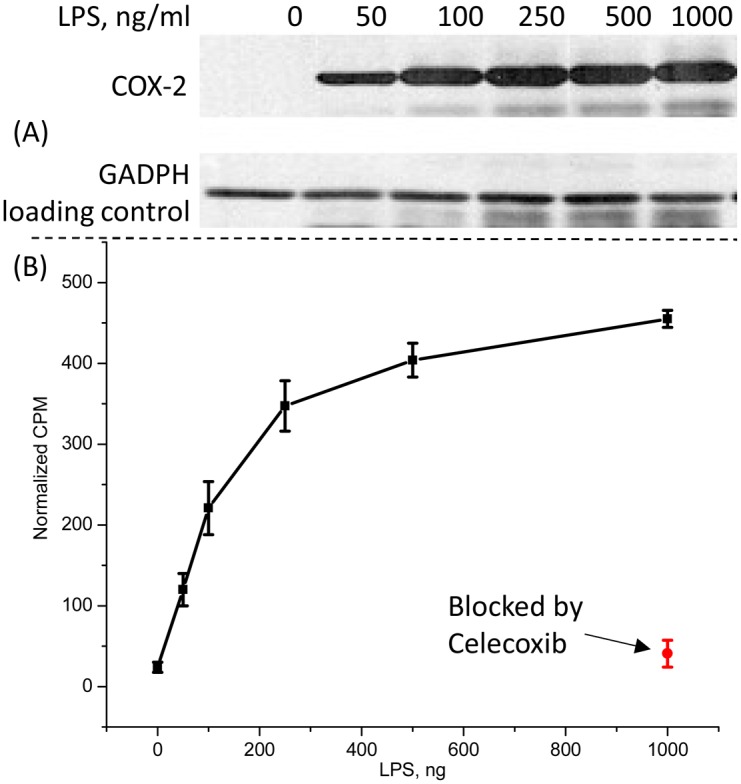
Fig 5. In vitro experiments.

(A) Western blot analysis of LPS treated cells. The upper panel is COX-2 expression and the lower blot is GAPDH loading control, (B) In vitro COX-2 dependent uptake of the probe in LPS-treated RAW264.7 macrophage-like cells, normalized to 1000 ng/ml of LPS.
