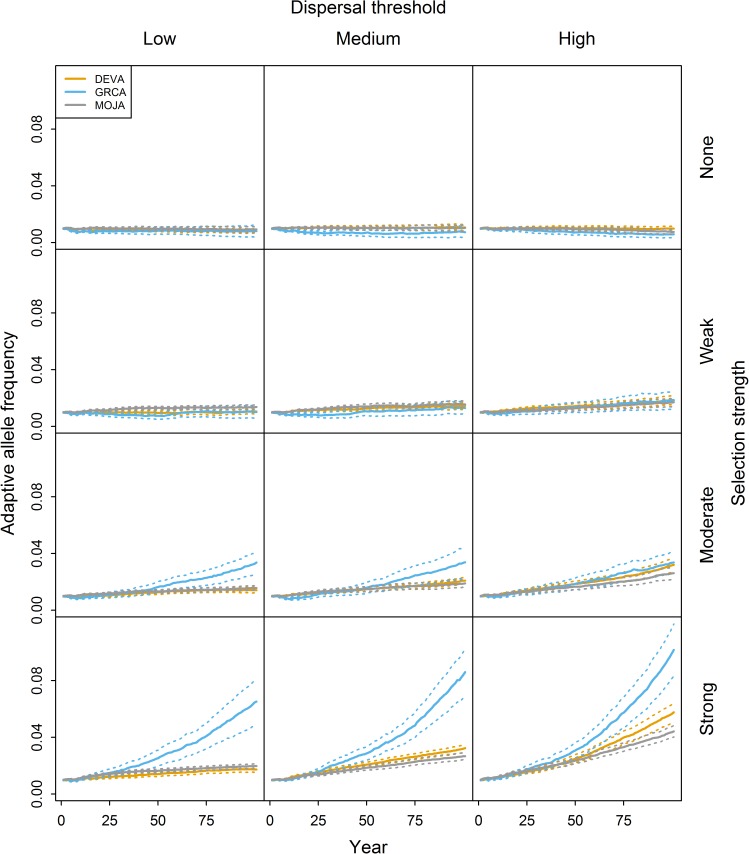
Fig 2. Simulated change in adaptive allele frequency through time under the novel allele scenario.
Results are shown for multiple selection strengths and dispersal thresholds in the DEVA, GRCA, and MOJA regions. Simulations were initiated with a small cluster of adaptive alleles at the center of each region. Rows and columns correspond to selection strengths and dispersal thresholds, respectively. Solid and dashed lines represent means and 95 percent confidence limits, respectively, from 50 MC replicates per region.

