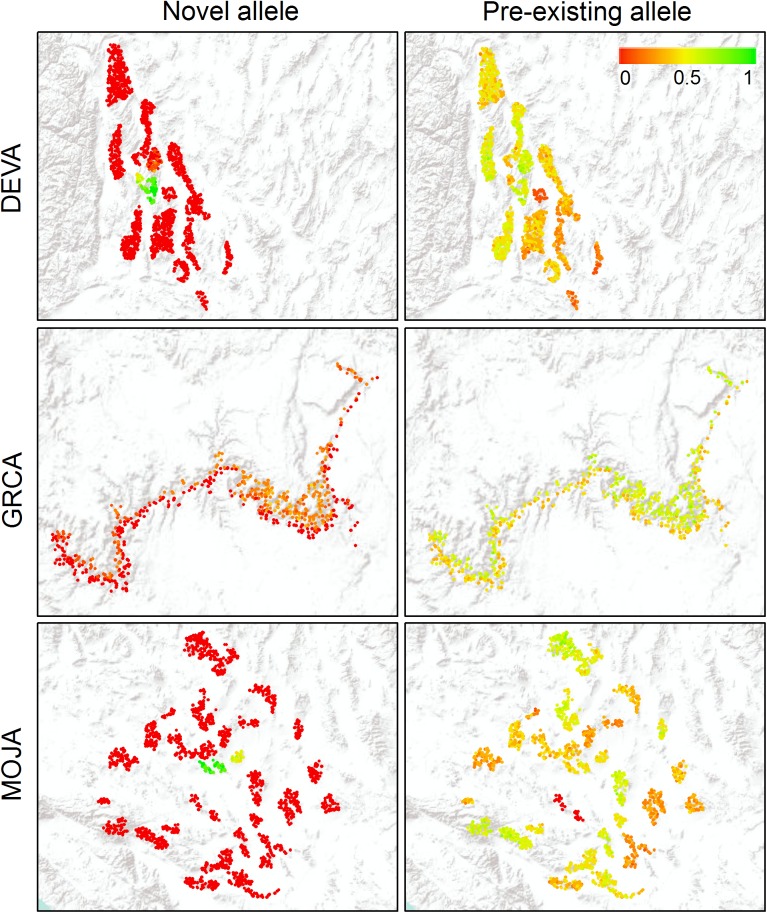
Fig 4. Simulated spatial spread of adaptive allele in different regions over 100 years.
Colored dots represent individual locations, and black polygons represent national park boundaries. Color gradient reflects proportion of MC replicates in which adaptive allele is present (≥1 copy) in each individual location at year 100 for each region and each scenario, assuming strong selection and medium dispersal threshold.

