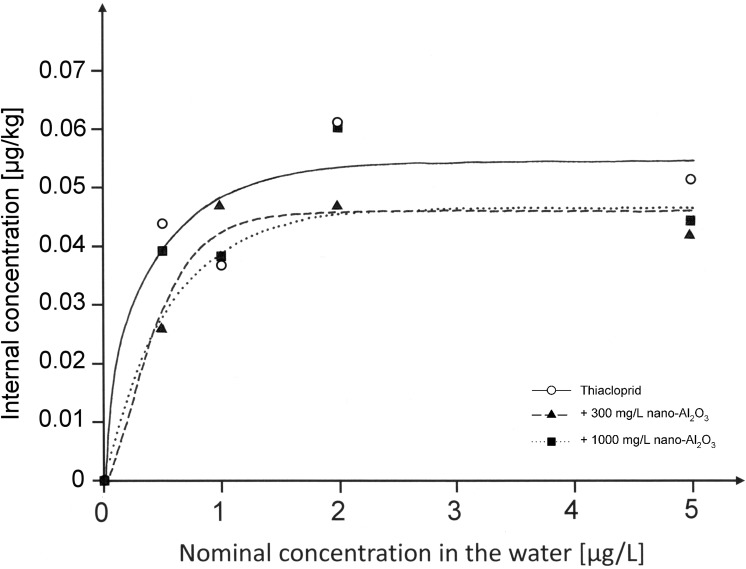
Fig 1. Internal thiacloprid concentrations in C. riparius larvae [μg/kg] vs nominal concentration in water [μg/L].
Larvae were exposed for 96 h before they were transferred to filtered and dechlorinated tap water for 24 h to empty their guts (n = 1–3). R2 of the respective regression curves were 0.91 for Thiacloprid, 0.97 for animals exposed to the mixture including 300 mg/L nano-Al2O3 and 0.82 for animals exposed to a mixture with 1000 mg/L nano-Al2O3. Nominal values are shown in this graph, whereas measured concentrations can be obtained from Table 1.

