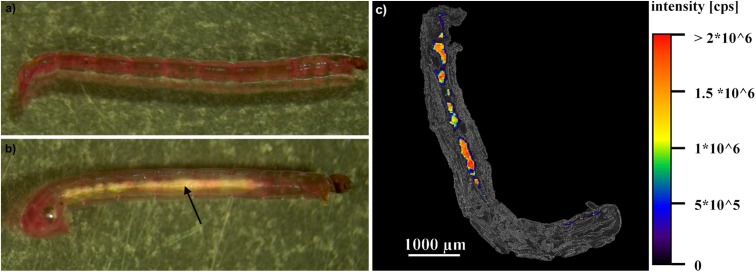
Fig 3. Images of C. riparius larvae.
a) photography of a larva from the control (after 96 h of exposure). b) photography of a larva exposed to 1000 mg/L nano-Al2O3 (after 96 h of exposure). The arrow marks the agglomeration of nano-Al2O3 within the gut. c) overlay of an image of a thin section of a larva (after 96 h of exposure to 1000 mg/L nano-Al2O3) at phase contrast and the aluminum distribution within this section, which was measured by LA-ICP-MS imaging techniques.

