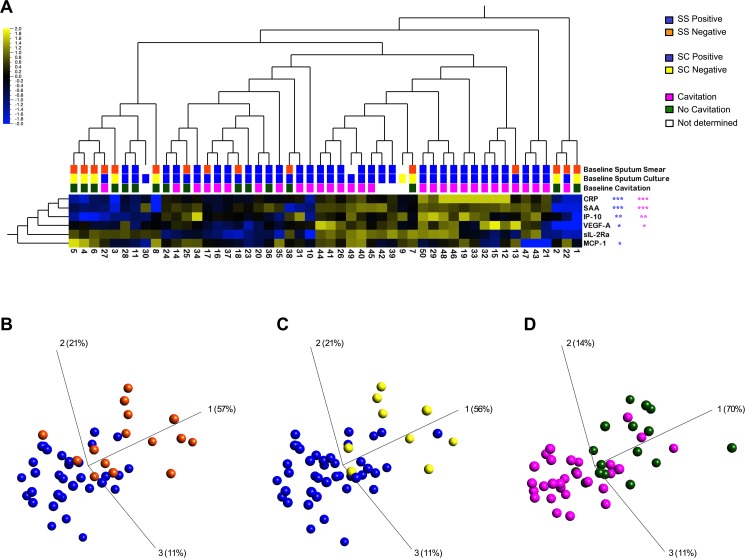
Fig 1. Baseline levels of plasma markers.
(A) Two-dimensional unsupervised hierarchical clustering of baseline analyte profiles in 50 patients, characterized by sputum smear (SS) and sputum culture (SC) status and cavitary vs non-cavitary disease. Normalized and log2 transformed values of analyte levels are indicated by the color scale, where yellow and blue represent expression levels above and below the median, respectively. Three-dimensional plots of principal component analysis (PCA) of (B) SS negative (orange) and SS positive (blue); (C) SC negative (yellow) and SC positive (blue); (D) cavitary (pink) and non-cavitary disease (green). Statistical comparisons using non-parametric Mann-Whitney U test were corrected for multiple comparisons through a false discovery rate (FDR) step down procedure (*: q<0.05, **: q<0.01, ***: q<0.001).

